
02The role of financial and professional services in cities
This section looks at what the contribution financial services and related professional services industries make to exports, jobs and productivity across British cities. It shows that, while London plays a big role in the UK’s financial and related professional services industries, this sector also plays an important role in many other cities too.
Exports
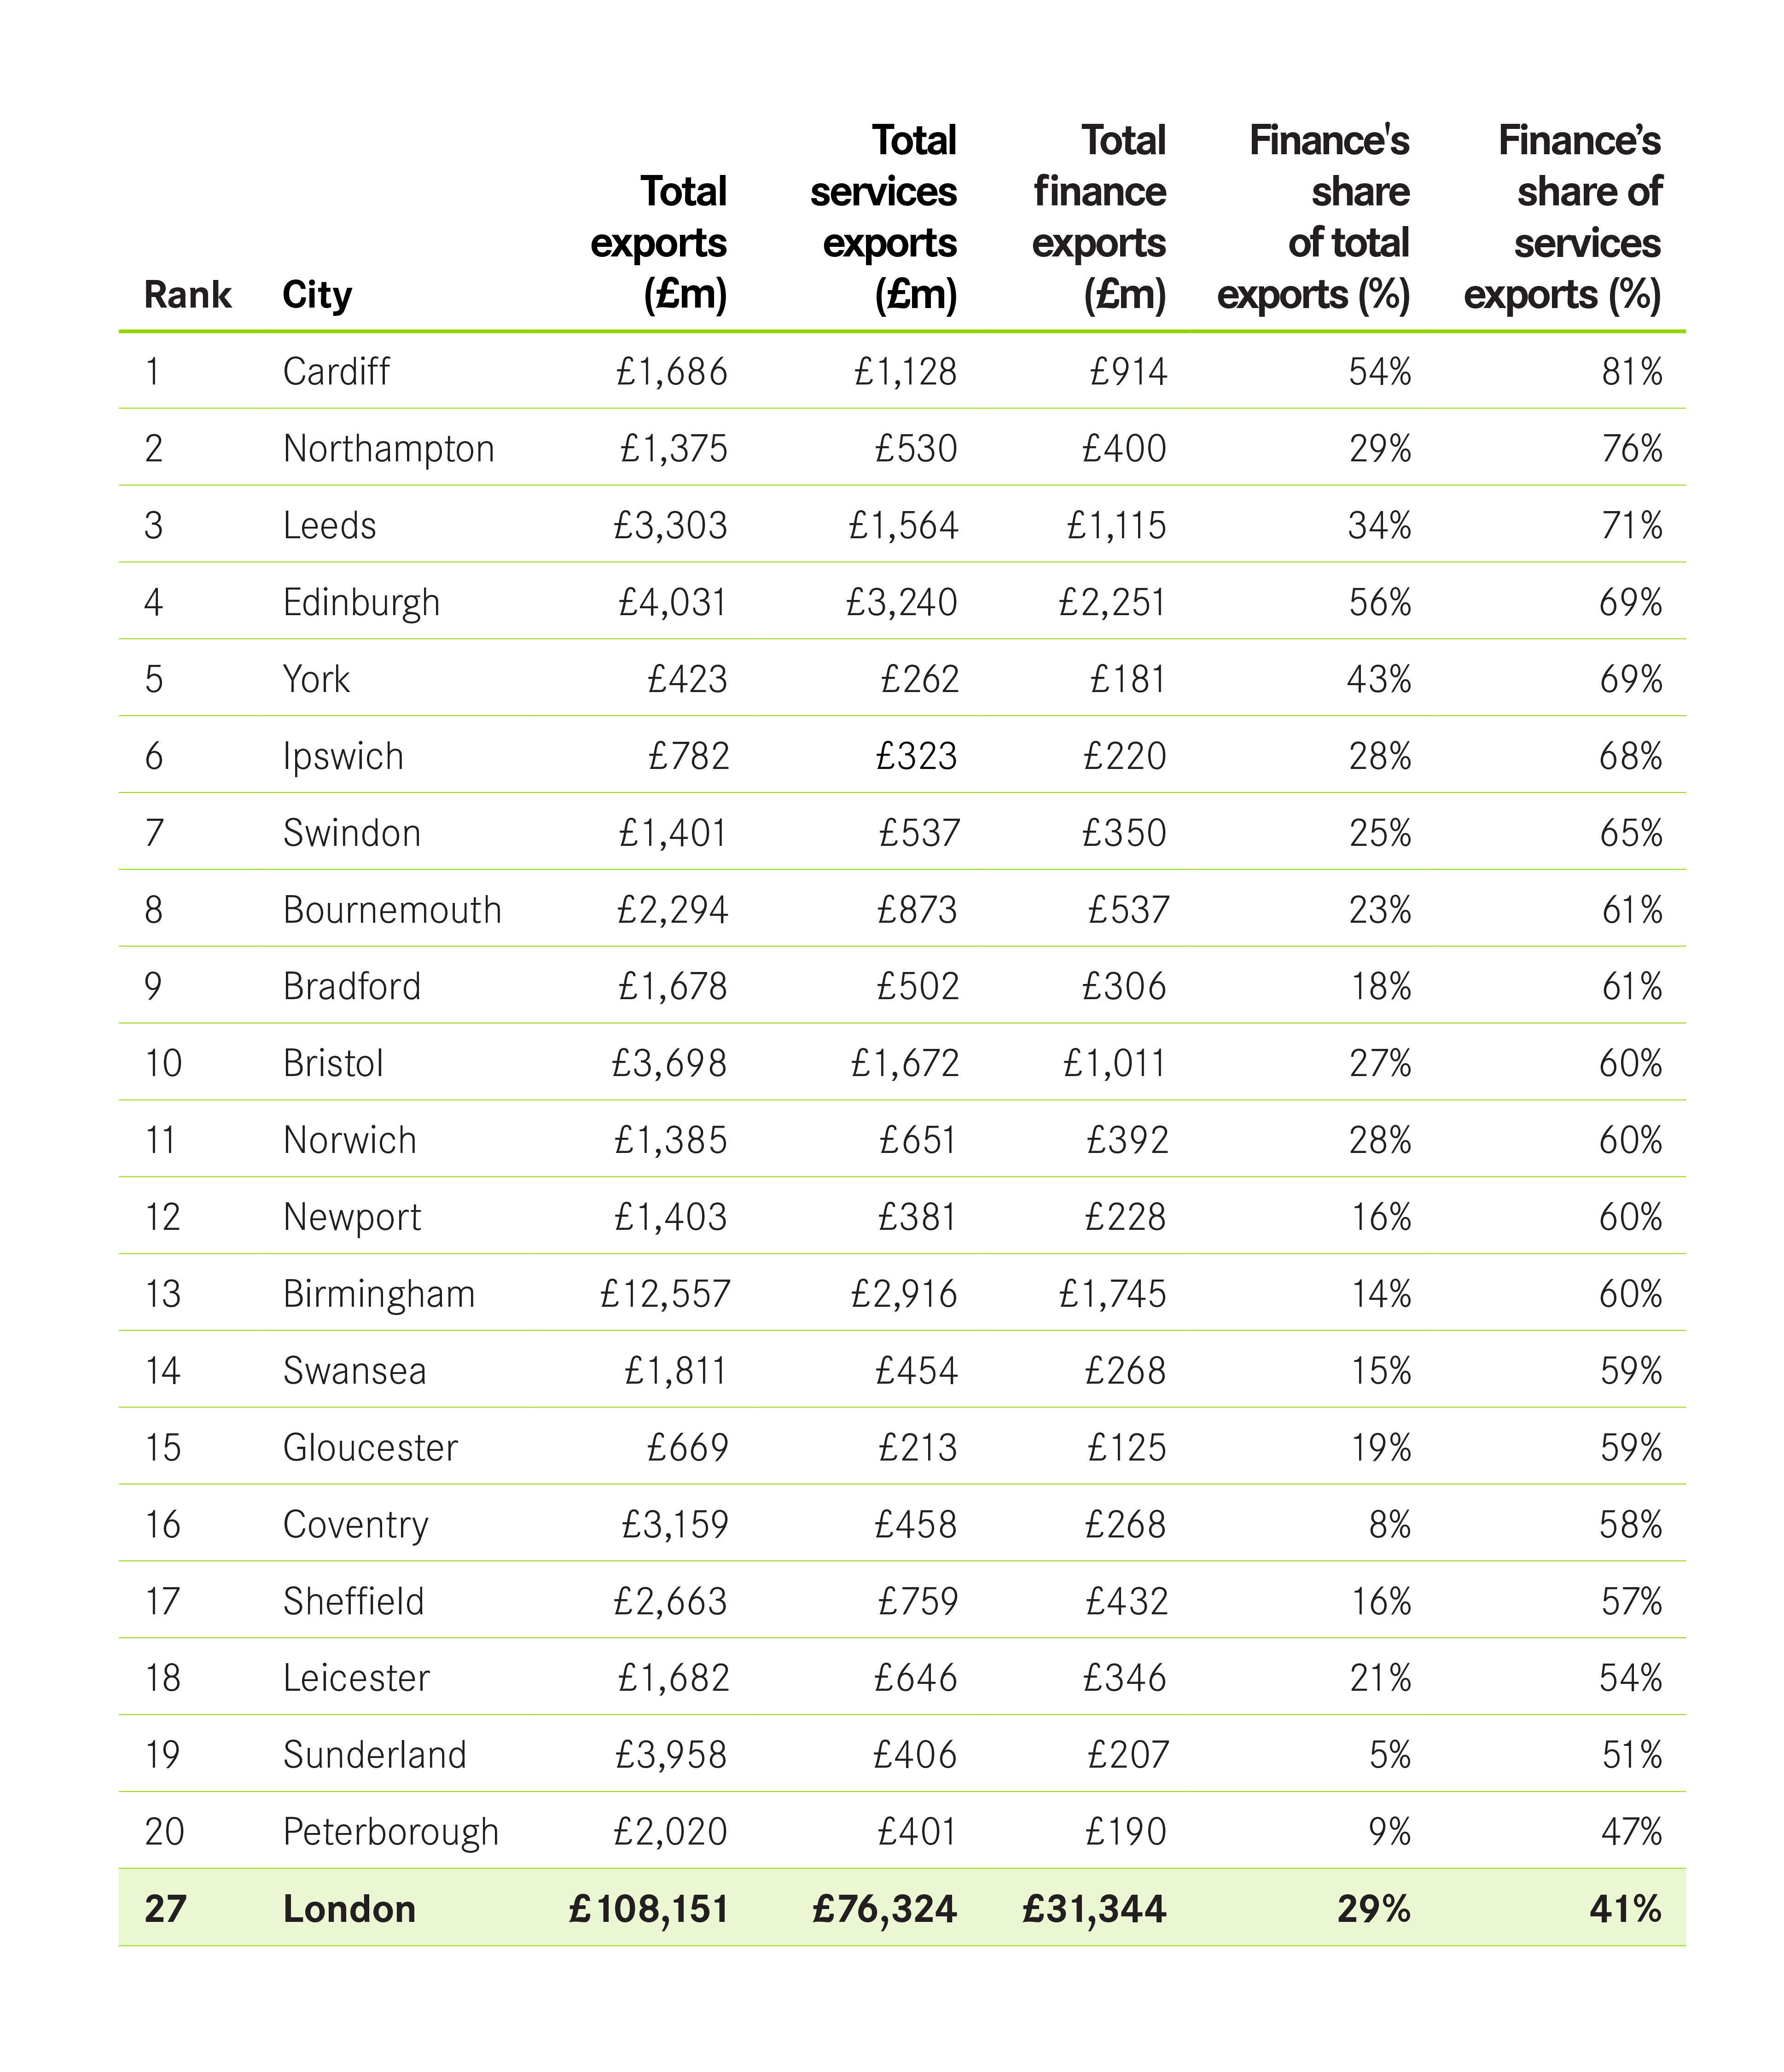
Britain’s financial exports are overwhelmingly produced in cities. While cities account for 53 per cent of all goods exports, they account for 75 per cent of all services exports, and 82 per cent of financial services exports.
Box 1: Methodology to calculate city exports
This briefing uses export data from 2015 to investigate goods exports, services exports, and financial services exports distinctly:
Goods exports of each type are matched with the industrial category that produces that type (e.g. exports of the type “Plastics in primary forms” are paired with the category “Manufacture of plastics products”). Regional export data of these types is then allocated by employment in their matched industrial categories across each region’s local authorities. This is then used to build up to the city (Primary Urban Area) level to identify how much cities are exporting of each type of goods.
Services use the same goods methodology, using the new experimental exports data by region and destination, albeit in broader industrial categories (e.g. “Real estate, professional, scientific and technical” covers a much larger share of employment than “Manufacture of plastics products”).
However, this services data excludes transport, travel (which are not relevant to this report) and financial services. As financial services export data by region by destination does not exist, regional financial services export data from the Pink Book was allocated across Census data on employment in professional, managerial, and technical jobs (those most likely to be associated with exports) in financial services by local authority.
Financial services exports in this section include financial and insurance services, but other activities associated with finance such as consulting are in the ‘Real estate, professional, scientific and technical’ category due to limitations with the experimental data.
London is dominant in the national share of financial exports, generating 47 per cent of the country’s financial services sold overseas, compared to the next largest financial exporters of Edinburgh and Manchester with 4 per cent, Birmingham with 3 per cent and Leeds and Glasgow with 2 per cent.
Although London is the leader in financial services exports in absolute terms, it is not the city most reliant on them. Financial services are a larger share of overall exports in Edinburgh, Cardiff, York, Northampton and Leeds than in London.
This trend is even sharper for services exports. Financial services are a larger share of services exports in 28 cities above London (see Figure 1), including Northampton, Edinburgh, Leeds, and Doncaster.
In some of these cities, financial services represent a high share of a low absolute number of services or total exports. Finance in Stoke, although accounting for a 43 per cent share of services exports, only amounts to 5 per cent of all exports due to the city’s manufacturing strengths. Similarly, even though 28 per cent of Exeter’s exports are financial services, the city’s total exports amount to less than £350 million a year.
Nevertheless, while a change in the UK’s trading relationships – both positive and negative – for financial services would in aggregate affect London the most, there would be substantial consequences for many other British cities.
Figure 1: Financial Services Exports, 2015
Productivity and jobs
Financial services are one of the most productive sectors in British cities. While the average output per worker in a British city was £58,900 a year in 2016, this was almost twice as much at £114,700 in financial services.
The role financial services plays across Britain varies. In terms of all private sector jobs, the share that it accounts for across cities ranges from just over 1 per cent in Aberdeen to 18 per cent in Edinburgh.
Importantly, the nature of these jobs – in terms of what they do – differs too. One way to see this is to look at how productivity of the financial services industry varies across Britain,1 as shown in Figure 2.
Figure 2: Financial services output per worker and share of all jobs
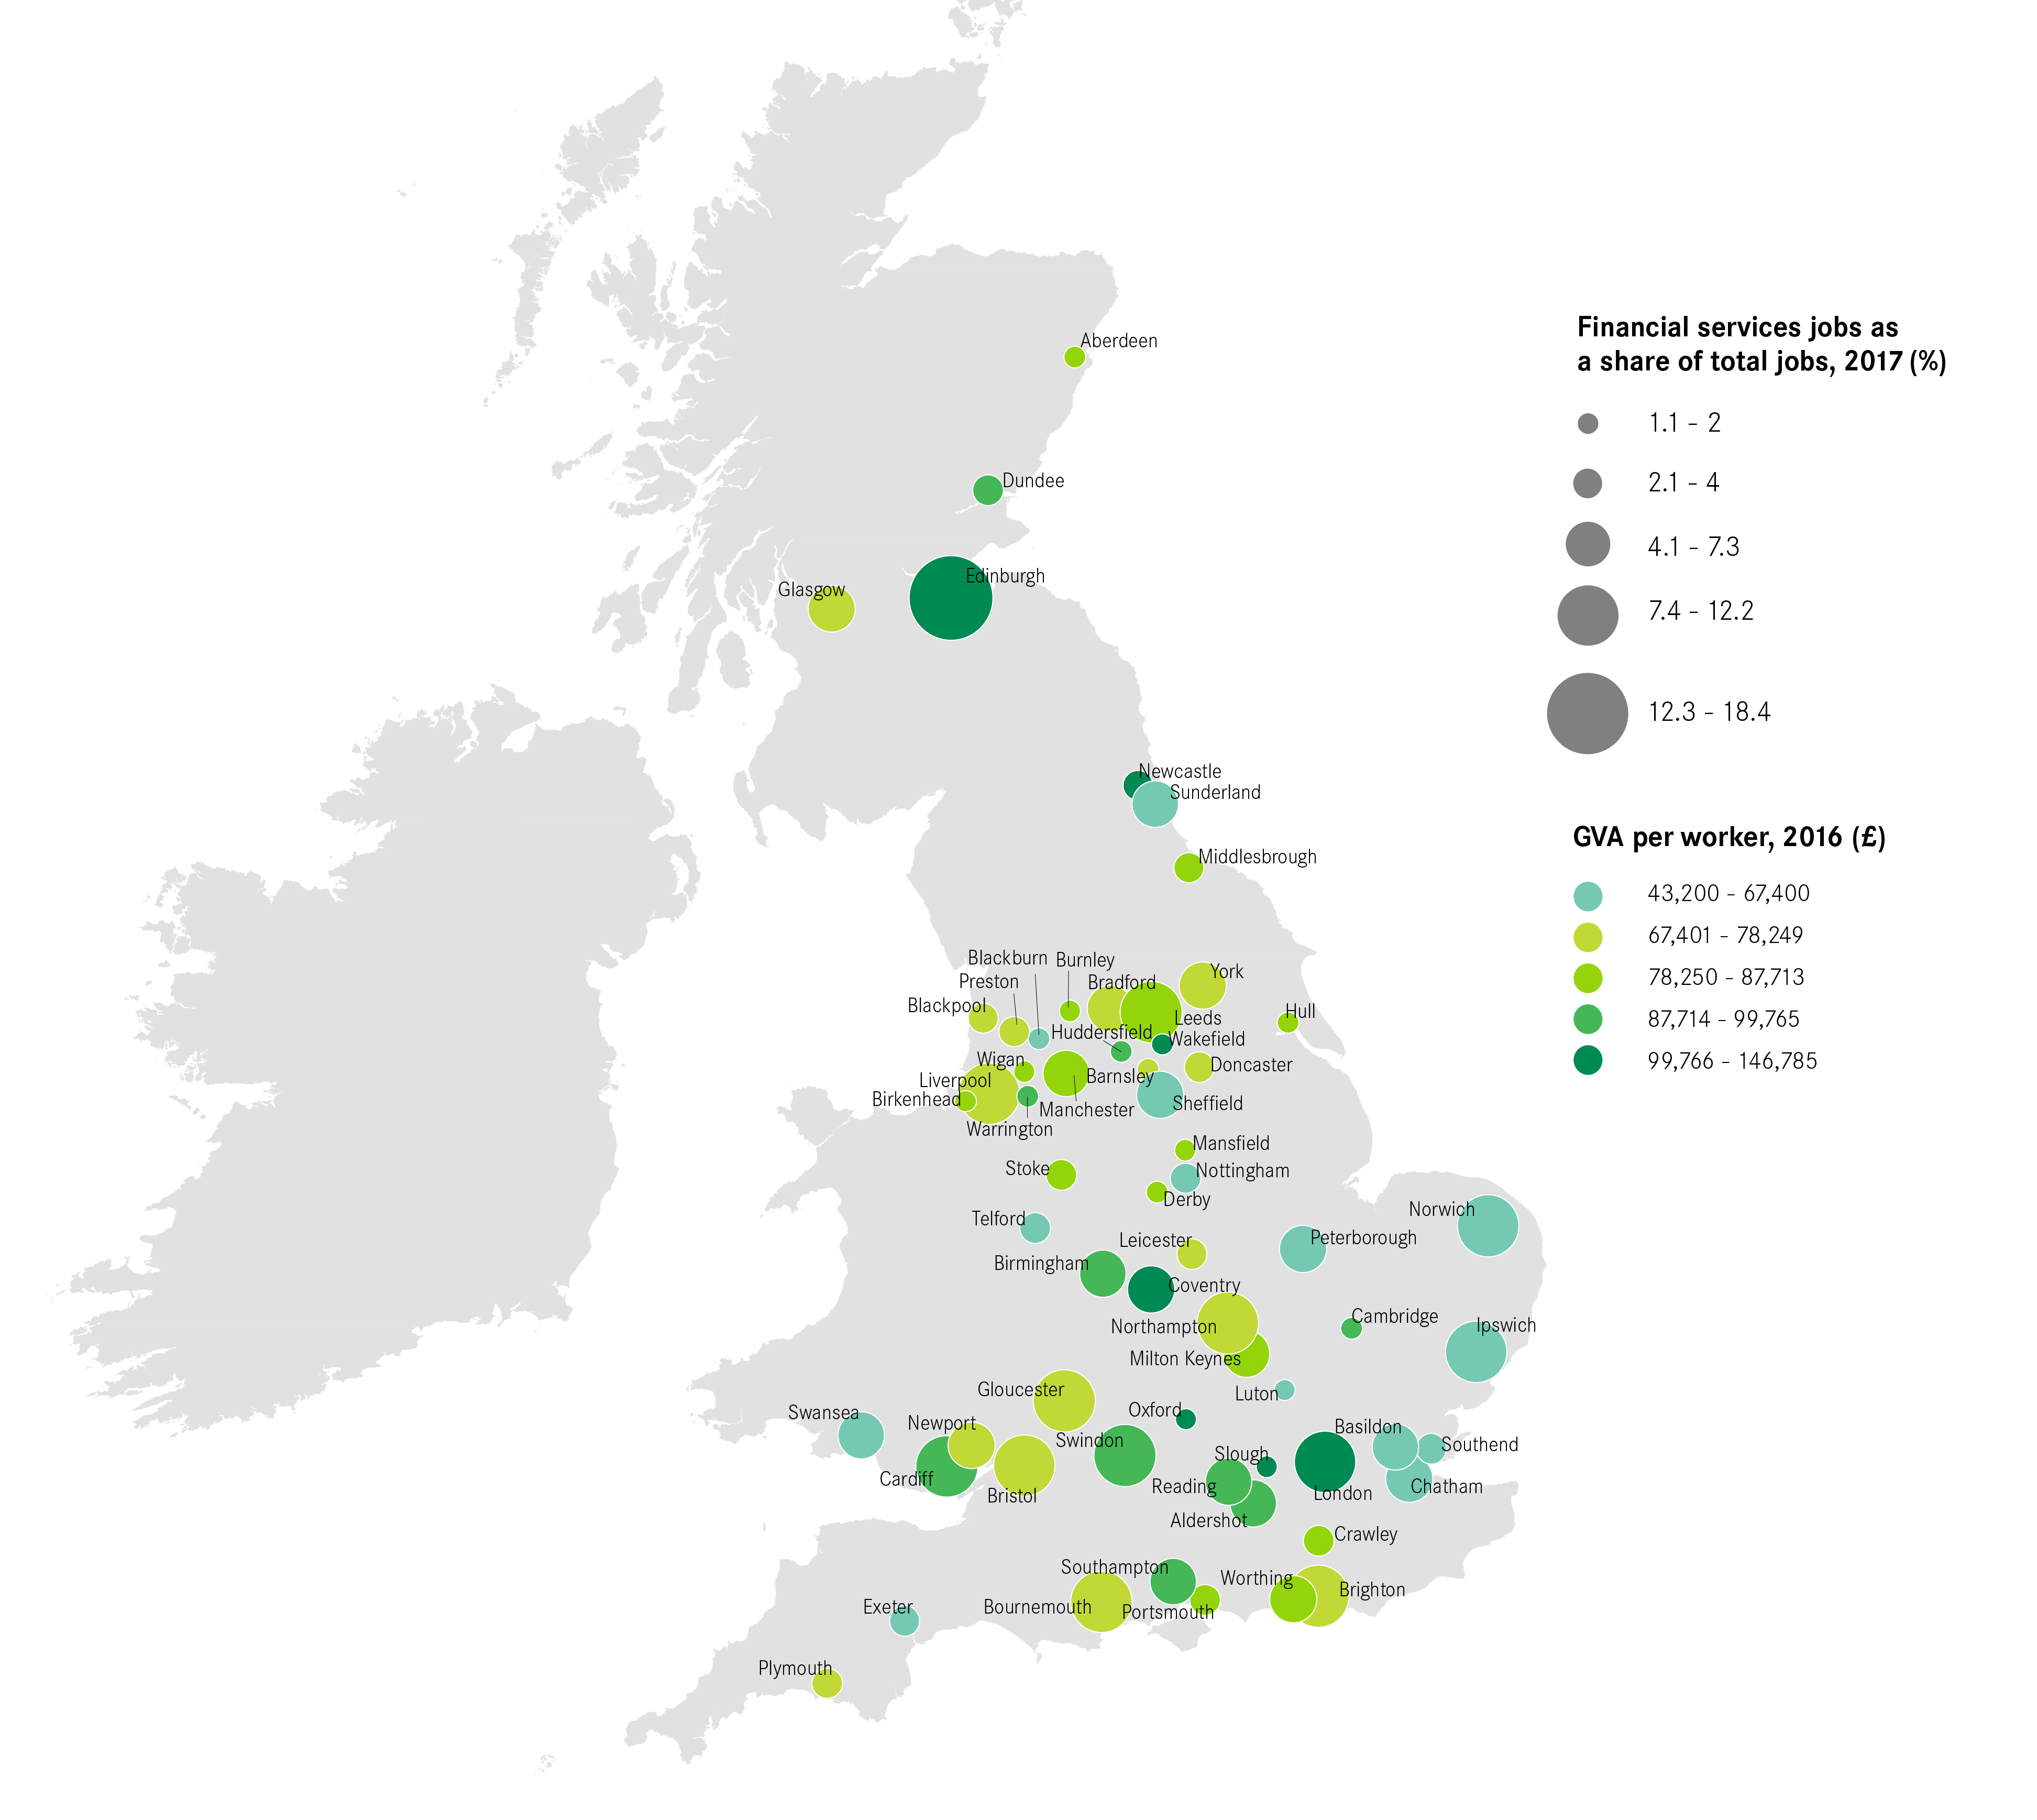
London has the most productive financial services sector, producing £146,800 for every worker in 2016. This was followed by cities to its west and north (for example Slough on £112,000 and Oxford on £117,600) and Scotland (e.g. Edinburgh, £111,000), and in a few cities in the North (e.g. Leeds on £87,100). In contrast, there appears to be a belt of low productivity finance stretching east out of London up the coast through to Norwich (£62,900), while the lowest productivity cities are Sunderland on £53,700 and Exeter on £43,200. That there is so much variation within the same sector shows that the nature of financial services looks very different across cities, reflecting how functions within the same sector are split across different locations.
It is important to note here that, while financial services productivity is low in a number of cities compared to London, it is still one of the most productive sectors in these cities, so plays an important role within them.
Looking at business services, which include professional services associated with finance,2 shows that there is a positive relationship between the productivity of financial and business services (see Figure 3). Like financial services, this in part reflects differences in the composition of business services across cities (i.e. more professional and fewer support services in more productive cities).
This again indicates that certain cities play specific roles in the UK economy, with higher-value activities across financial and professional services tending to locate in specific cities. For instance, cities with more jobs in venture capital, are also more likely to have more employment in roles like strategic consulting. In contrast, those cities that play back-office functions for finance, such as call centre operations, are also more likely to perform similar functions for related sectors. This split in tasks results from the relative advantages that different places offer to business, which is discussed in more detail later in the report.
Figure 3: Productivity of financial and professional services, 2016
