
03The migration of students and graduates
Students make up a large share of overall internal migration. Those moving from one region to another to go to university accounted for approximately one fifth of all movements in 2014 in England and Wales. As Figure 6 shows, these movements caused a shift in this population away from non-urban areas of the country into cities, with large and medium-sized cities seeing the largest inflows from non-urban areas.8
Figure 6: Share of all students at university in 2014/15 by their home and university town
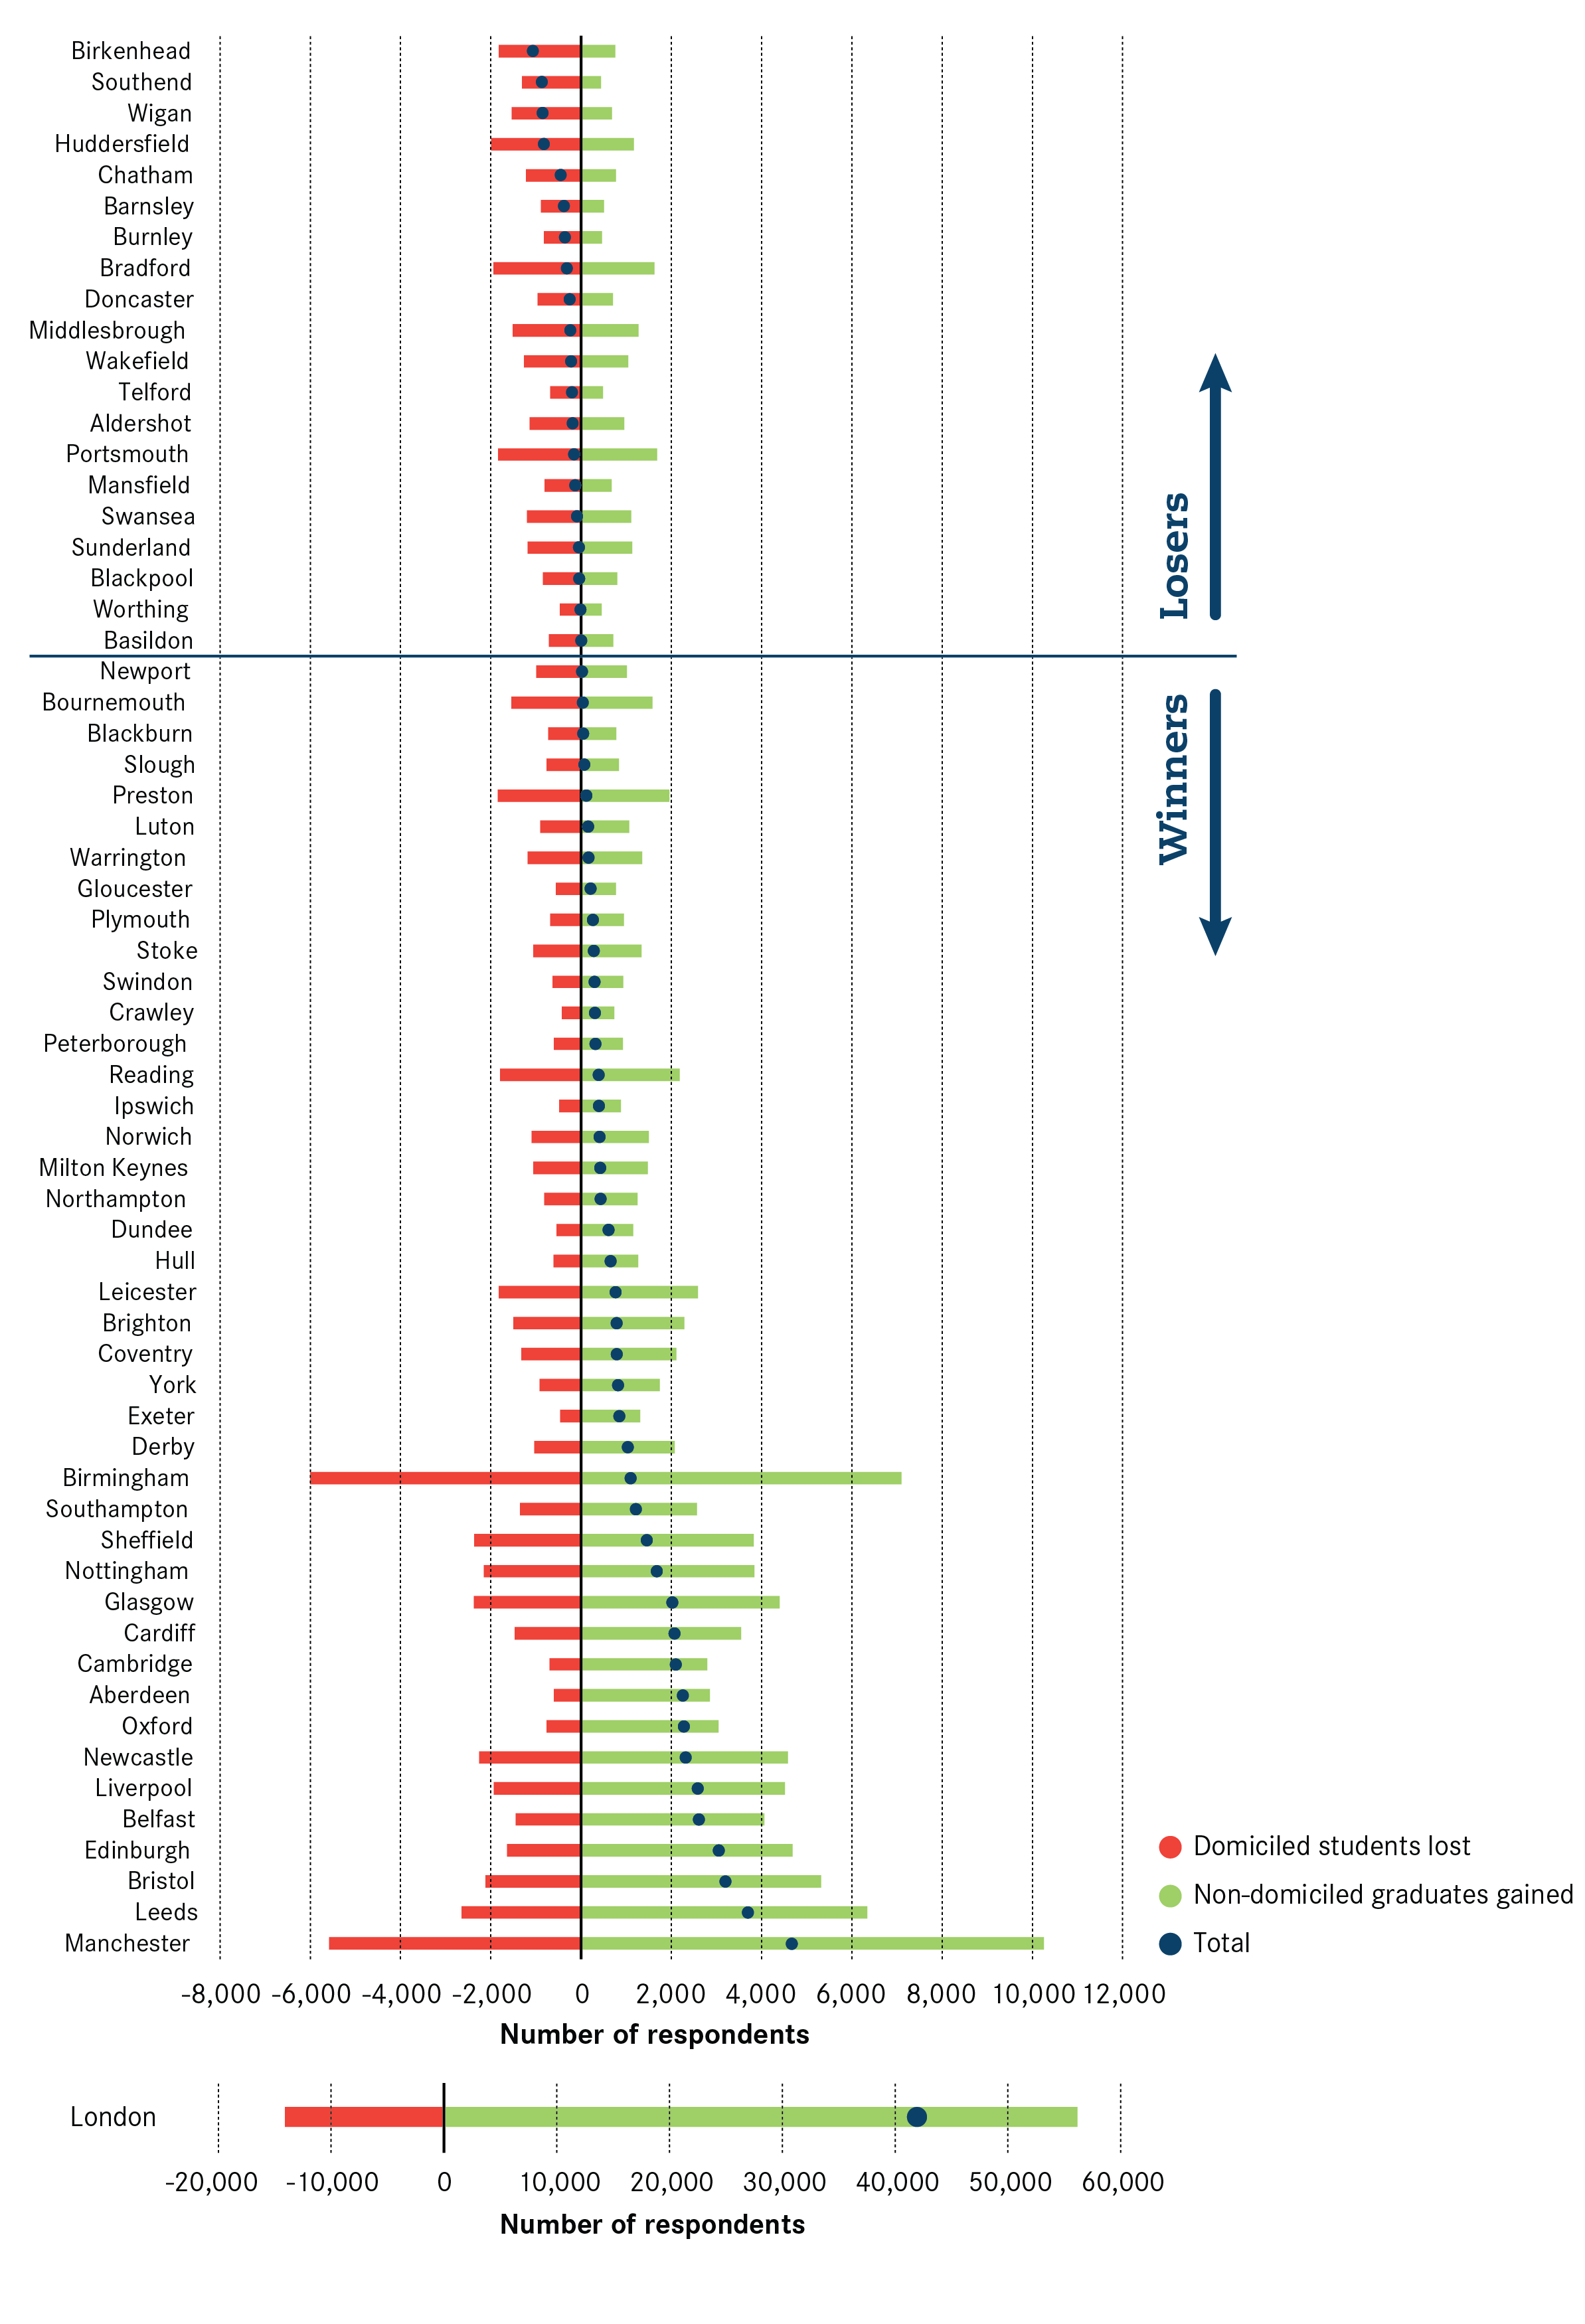
Large cities were the biggest winners from these moves. As Figure 7 shows, Leeds, Nottingham and Sheffield saw the largest net inflows, with an influx of around 30,000 students to each city. Meanwhile there were 23 cities that saw a net outflow of students. Unsurprisingly, the majority of these cities have no large university campus in them, for example Aldershot and Wakefield.
Figure 7: Net flows of students at university in 2014/15
The one exception was London, which despite its 49 higher education institutions experienced by far the largest net outflow. Of all the students at university in 2014/15, 50,000 more students moved from London to somewhere else in the UK than those doing the reverse move. The capital did not lose students overall though, as this outflow was more than offset by an inflow of over 100,000 students from the rest of the world.
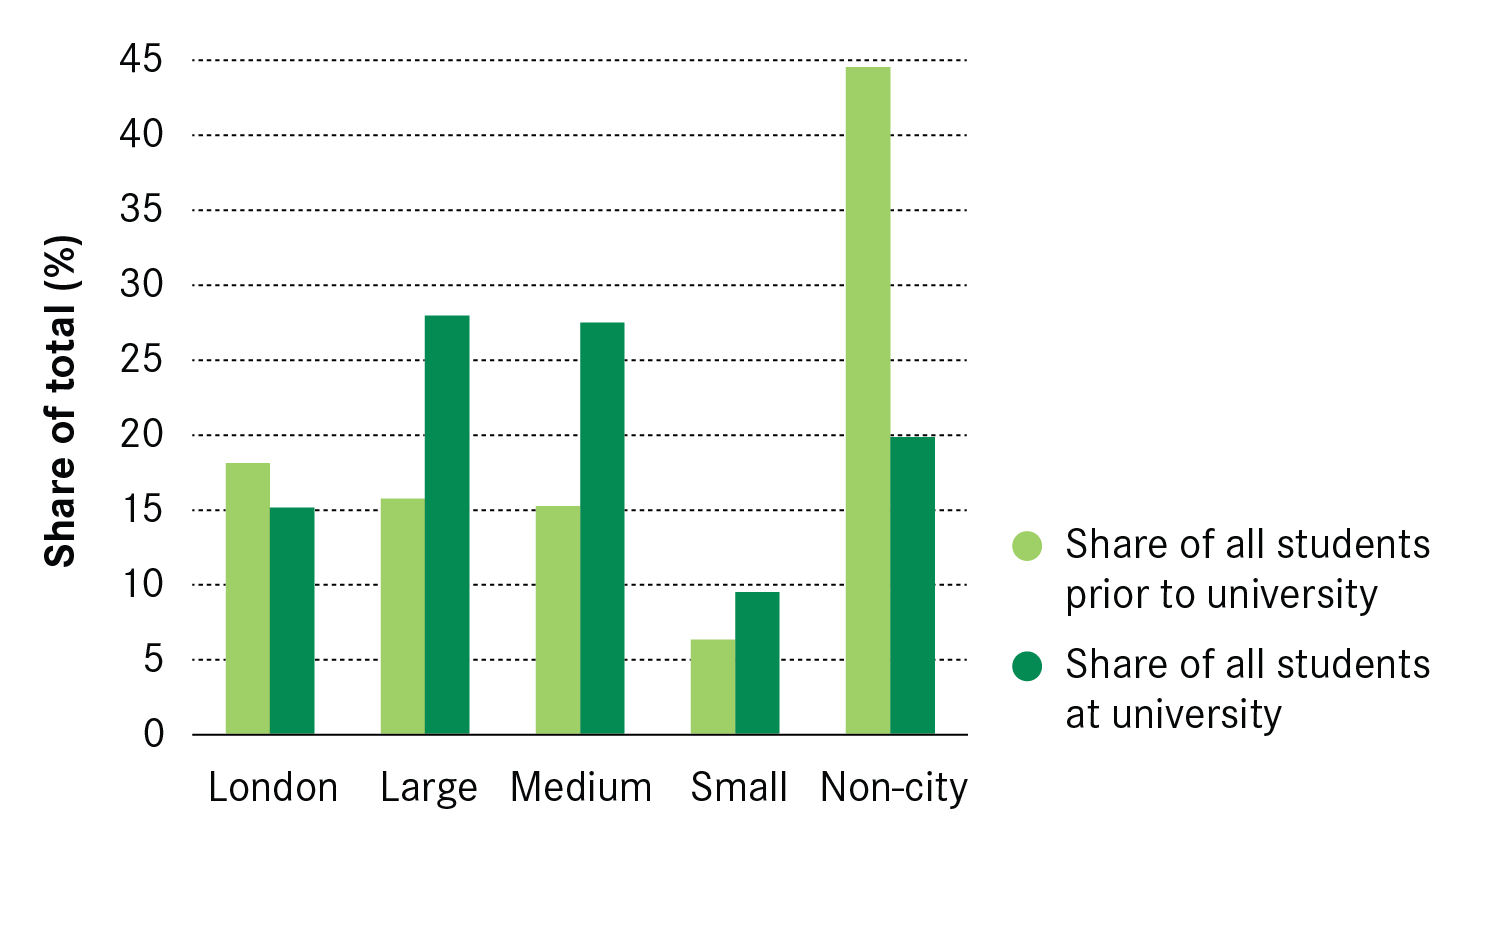
The result was that these movements caused a shift of UK students away from London to the rest of the country, as shown in Figure 8. Large cities were the biggest winners, but medium and small cities saw a net inflow too.
Figure 8: Where students at university in 2014/15 came from

Graduation signals a stark change in movements, with London the big winner
These patterns reverse once students graduate. Among cities, London went from experiencing the largest net outflow of students to experiencing the largest net inflow of new graduates, while the opposite was the case for large cities (see Figure 9). The result was that almost a quarter of all new graduates from UK universities worked in London six months after graduation, which was larger than the 19 per cent of British jobs that were located in the capital (see Figure 10). Non-city areas also saw a large inflow of graduates, which in part reflects the large number of universities based in cities.
Figure 9: Flow of graduates six months after graduation, 2013/14 and 2014/15
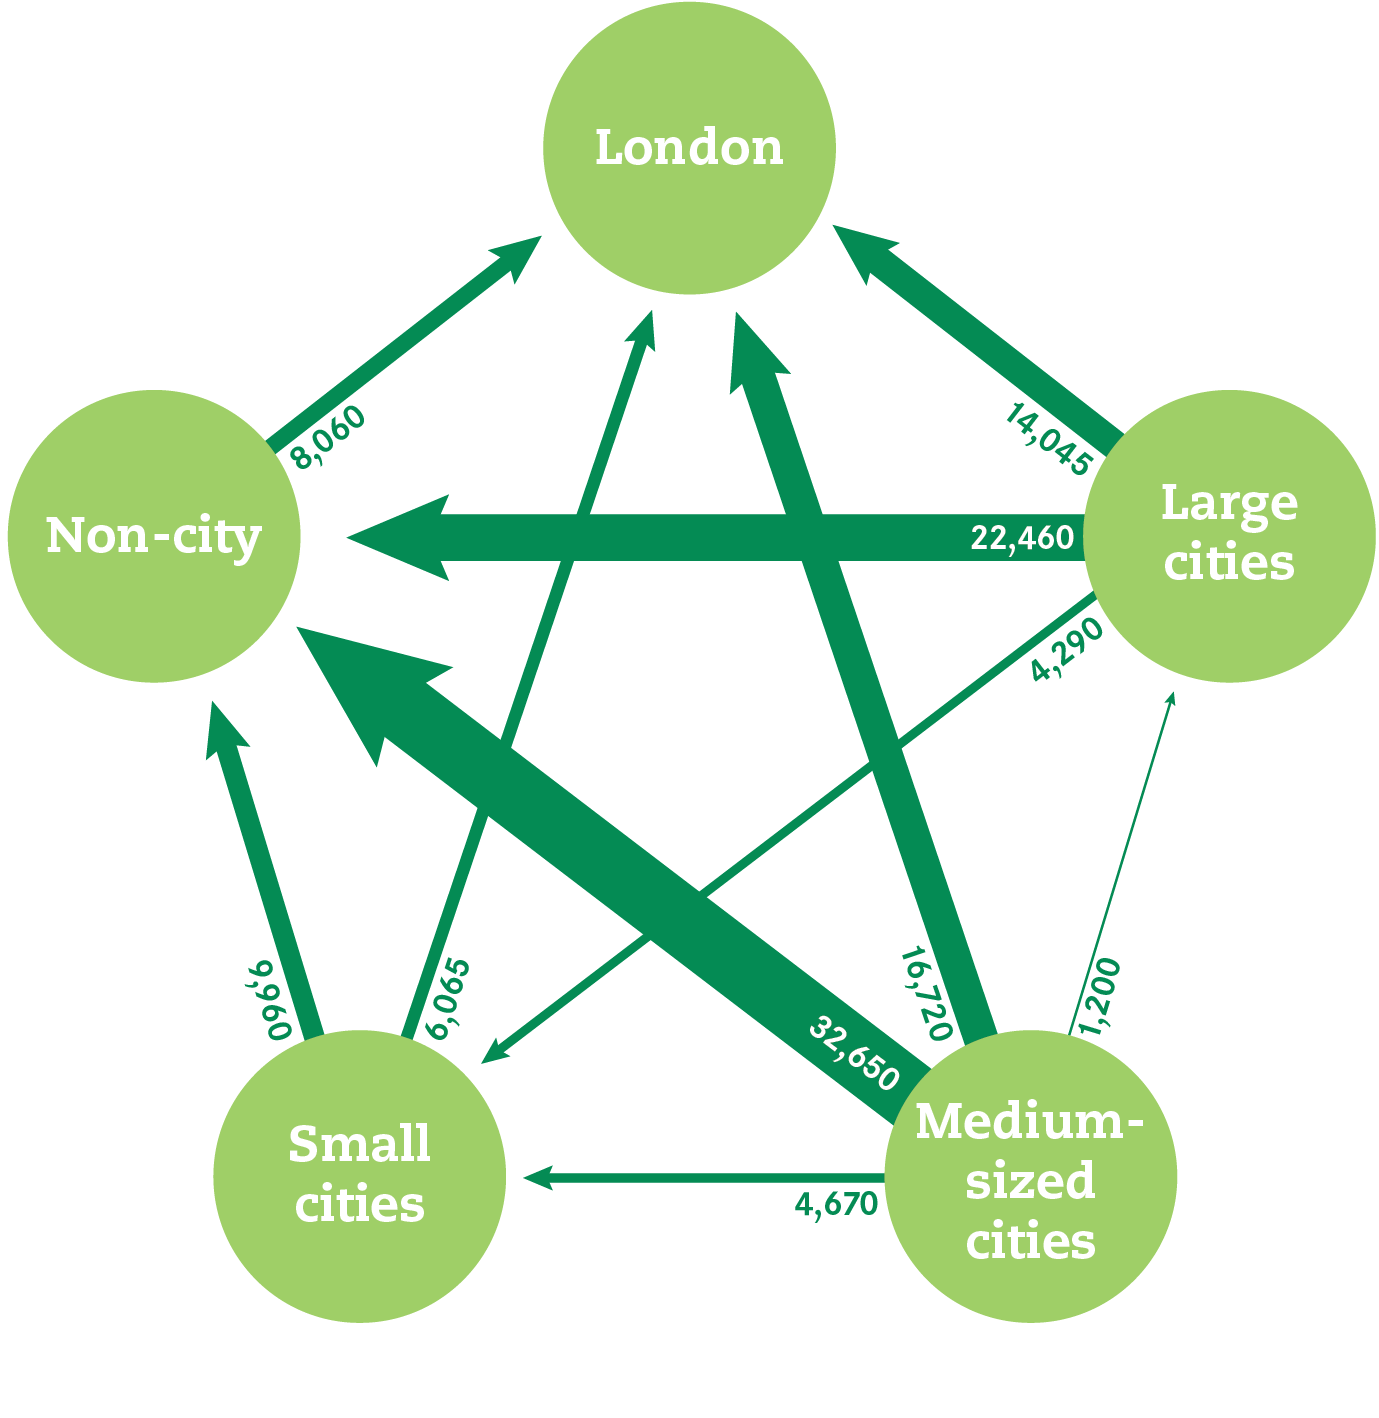
Figure 10: Share of all working graduates six months after graduation
London’s success is based on its ability to both retain and attract graduates
London’s over representation of new graduates is a result of two factors – its ability to retain its students, and to attract in graduates from elsewhere.
Looking first at retention, Figure 11 shows that London had by far the highest retention rate of any city, with 77 per cent of its students staying to work in the capital. Of cities with at least one substantial university campus, Manchester, Belfast and Birmingham had the next highest rates, with around 50 per cent of students who studied in these cities also working in them six months later. As a group, large cities (at 38 per cent) had higher retention rates than medium (26 per cent) and small cities (23 per cent).
Figure 11: Graduate retention rate by city, 2013/14 and 2014/15
Second, looking at the movement of students after graduation shows that London was also very successful at attracting in graduates from elsewhere. Of all the graduates who moved city after university, 22 per cent moved to London (see Figure 12). Part of this was a result of London’s success in attracting back students that grew up there but went to study elsewhere (Box 1). As Figure 13 shows, London also saw a net inflow from virtually every other city in the UK.
Figure 12: Distribution of those who worked in a different city after graduation to where they studied, 2013/14-2014/15
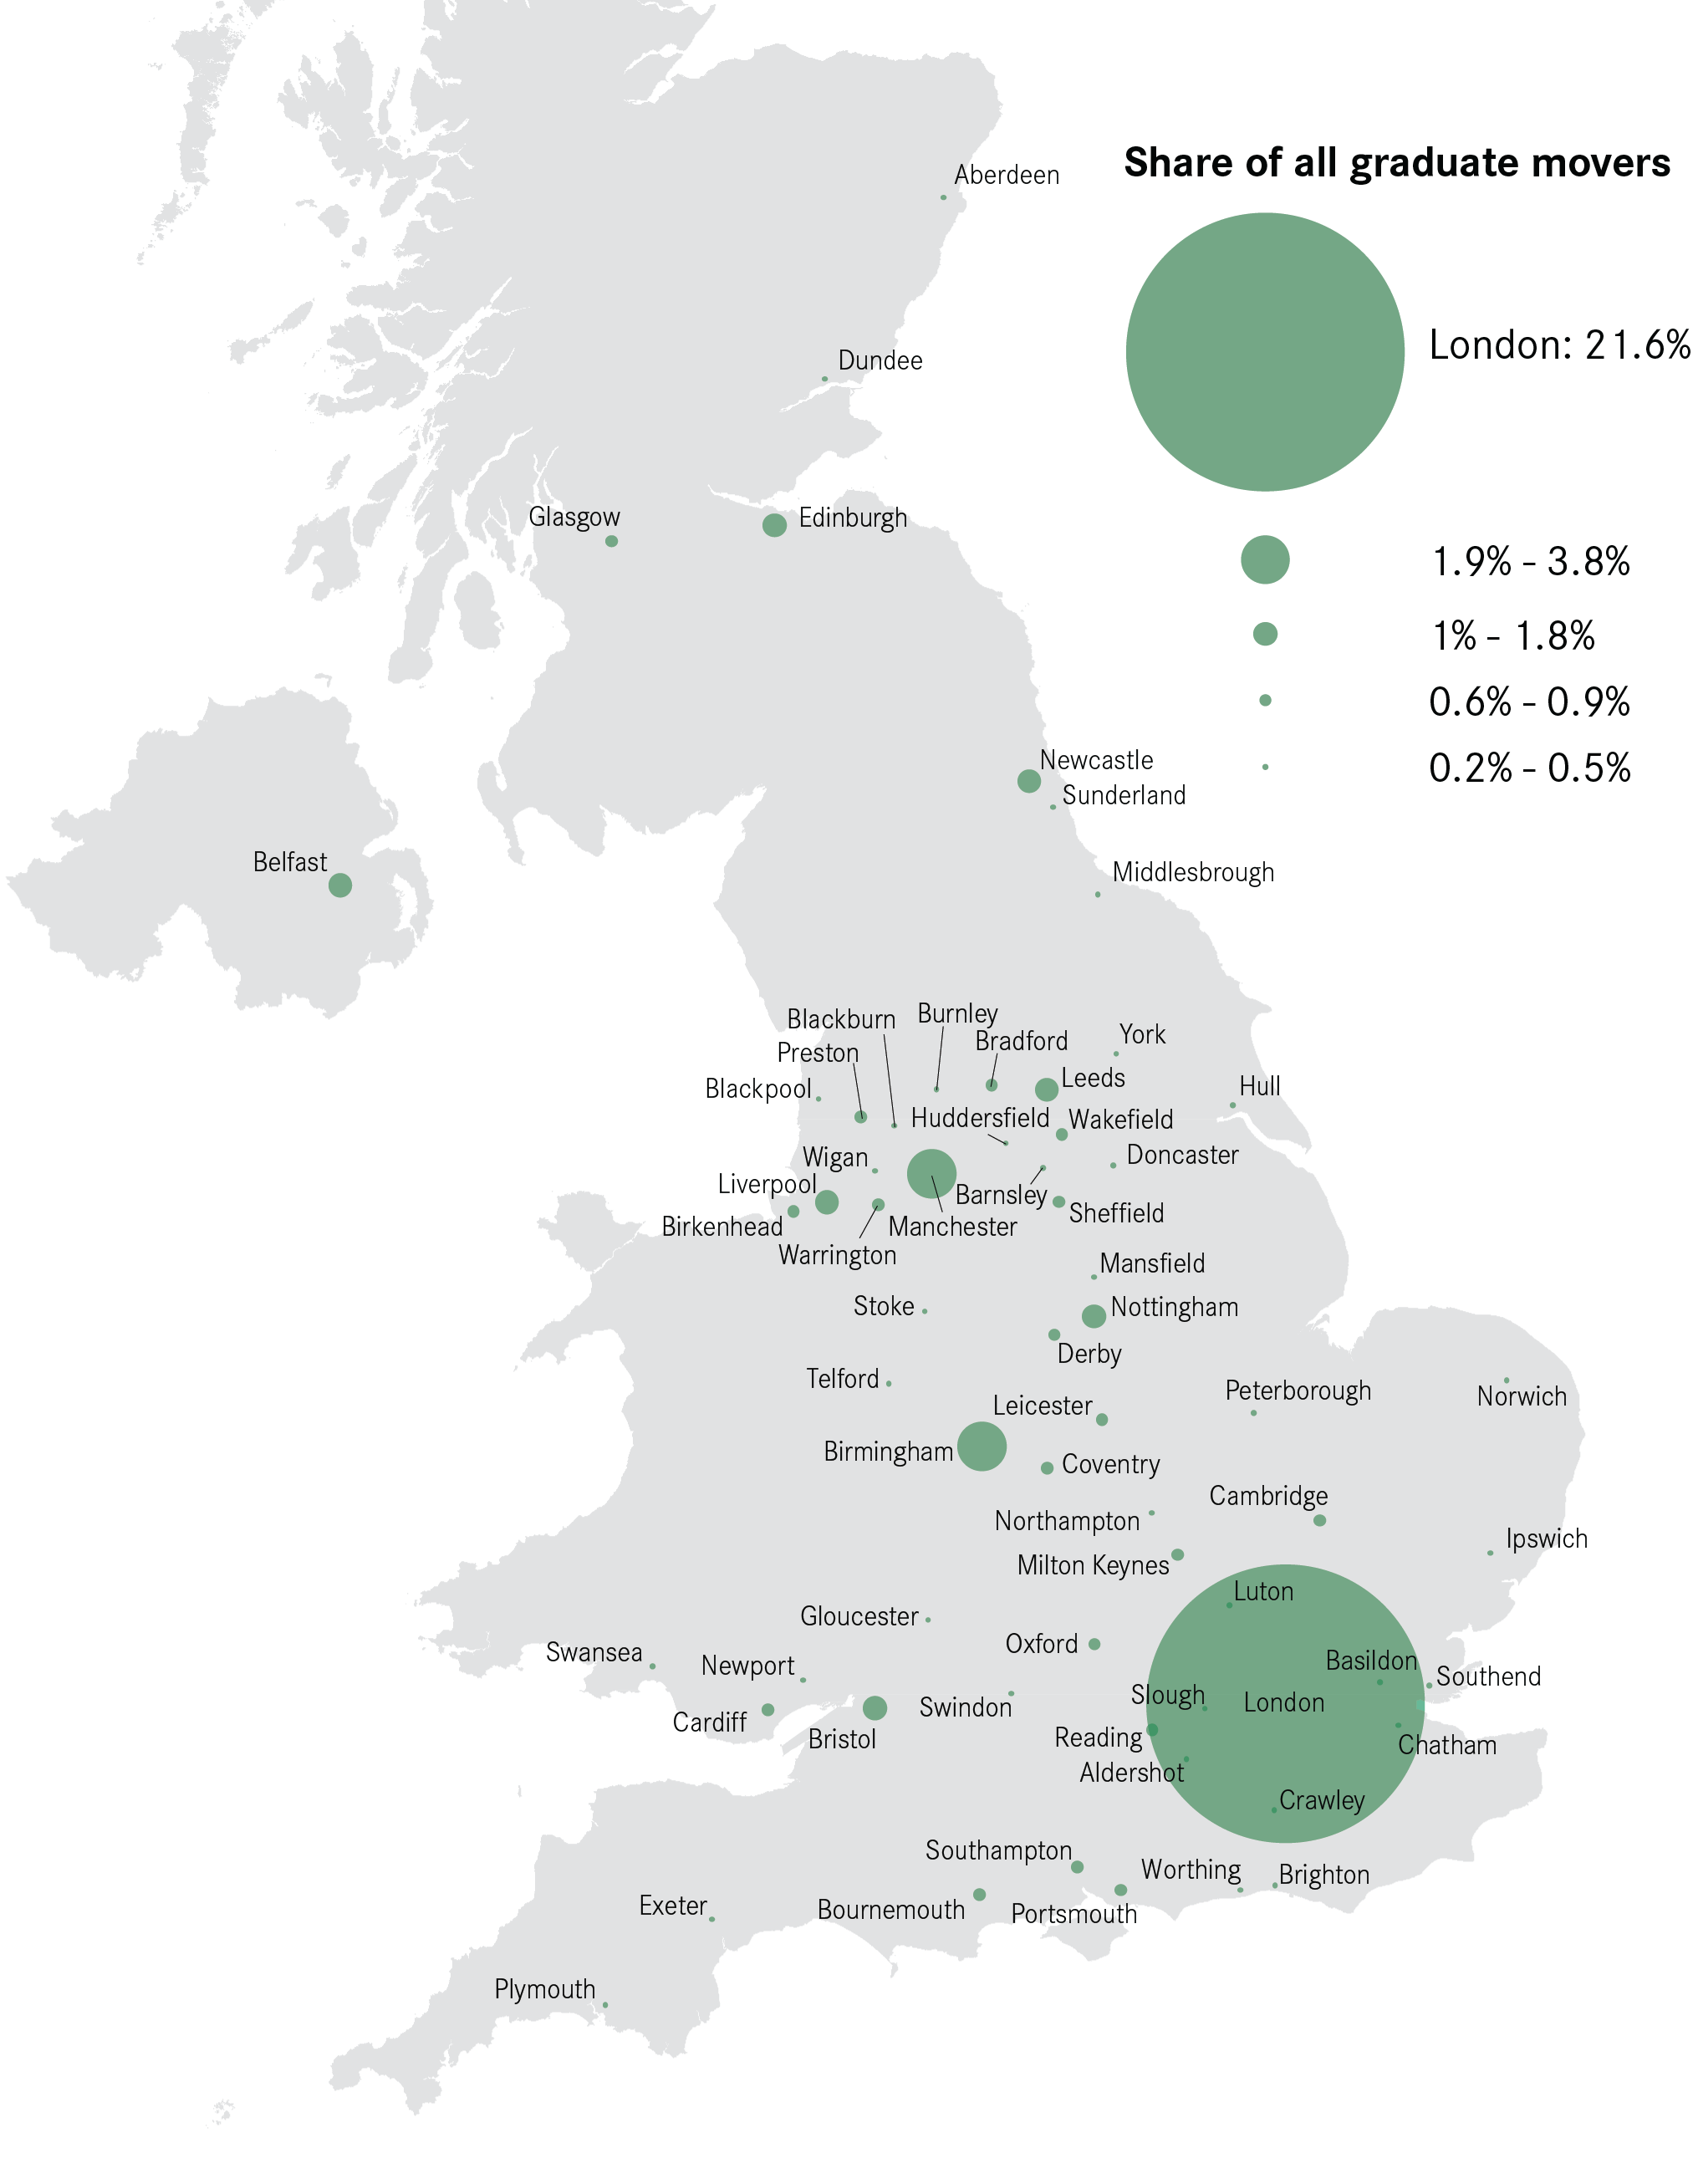
Figure 13: Net flow of graduates from other cities to London, 2013/14-2014/15

Box 1: The march of the returners
The pull of London is very strong for those who moved away from the capital to go to university – 74 per cent of students who left London came back to work. Other large cities also exerted a large pull on their former residents with Manchester, Birmingham and Newcastle also in the top five on this measure.
The share of students who return to their home town to work, 2013/14-2014/15
Source: HESA destination of leavers survey
London’s attraction is even greater for high achievers
Of all graduate movers who achieved a first or upper second class degree from a Russell Group university, 37 per cent of these graduates worked in London six months later. Box 2 discusses how this is even more pronounced for Oxbridge graduates. This meant that, as Figure 14 shows, all other city groups attracted a lower share of high achieving Russell Group graduates than their share of jobs would suggest.
Figure 14: Share of all moving graduates by institution and class of degree, 2013/14-2014/15

Large cities attracted a lower share of all working graduates, relative to share of jobs, irrespective of their degree and institution. However, they were most successful at attracting those students that achieved a lower second class degree or lower from a non-Russell Group university.
Box 2: The movements of Oxbridge students and graduates
The patterns for Oxbridge graduates who move after gaining a first or upper second class degree are even more pronounced than those seen for Russell Group graduates. As the table below shows, over a quarter of all Oxbridge students came from London, which is higher than the 15 per cent share of total population the capital houses. 52 per cent of Oxbridge graduates who moved after graduation were working in London six months after completing university.
Where moving Oxbridge students came from, and where they went to work, 2013/14-2014/15
Source: HESA destination of leavers survey
Most cities experience a graduate gain
Despite the pull of London, most cities still see an overall increase in their numbers of new graduates for 2013/14 and 2014/15. This is for two reasons. The first is because they see a graduate gain from elsewhere – some people move in to a city to study and stay, and others move in to work after graduation. And the second is that some students never move, studying and working in the cities where they grew up.
Figure 15 shows the scale of the graduate gain for each city, comparing the number of graduates attracted to the city (either for study, who subsequently stayed, or for work) against the number of graduates born in that city who do not work there (either because they left for university and never came back, or because they left on graduation).
But this graduate gain is small relative to the potential gain if ‘bouncers’ were to stay in the city they studied in. Bouncers are those people who are attracted to a city to study but subsequently leave on graduation to work in another city. These people made up a large proportion of all graduates. Of all of those working graduates who went to a city to study, 46 per cent of them moved twice, first for university and second on graduation. By way of comparison, just 15 per cent of graduates that went to a city to study subsequently stayed in that city for work.
Figure 15: The balance between the loss of domiciled students against the gaining of graduates from elsewhere, 2013/14 – 2014/15
It is bouncers that drive the inflows and outflows of people to and from cities and so drive the brain drain overall. It is not that cities outside London do not retain graduates; it is that they do not retain the majority of those students that move to their city to study. Of all the bouncers, 40 per cent were working in London six months after graduation.
Figure 16 shows how the number of bouncers overshadowed the graduate gain for all but London. In Manchester, for example, 67 per cent of the students who went to study in the city left upon graduation. In Birmingham this figure was 76 per cent. And in Southampton it was 86 per cent.
Figure 16: The bouncers and the graduate gain, 2013/14-2014/15
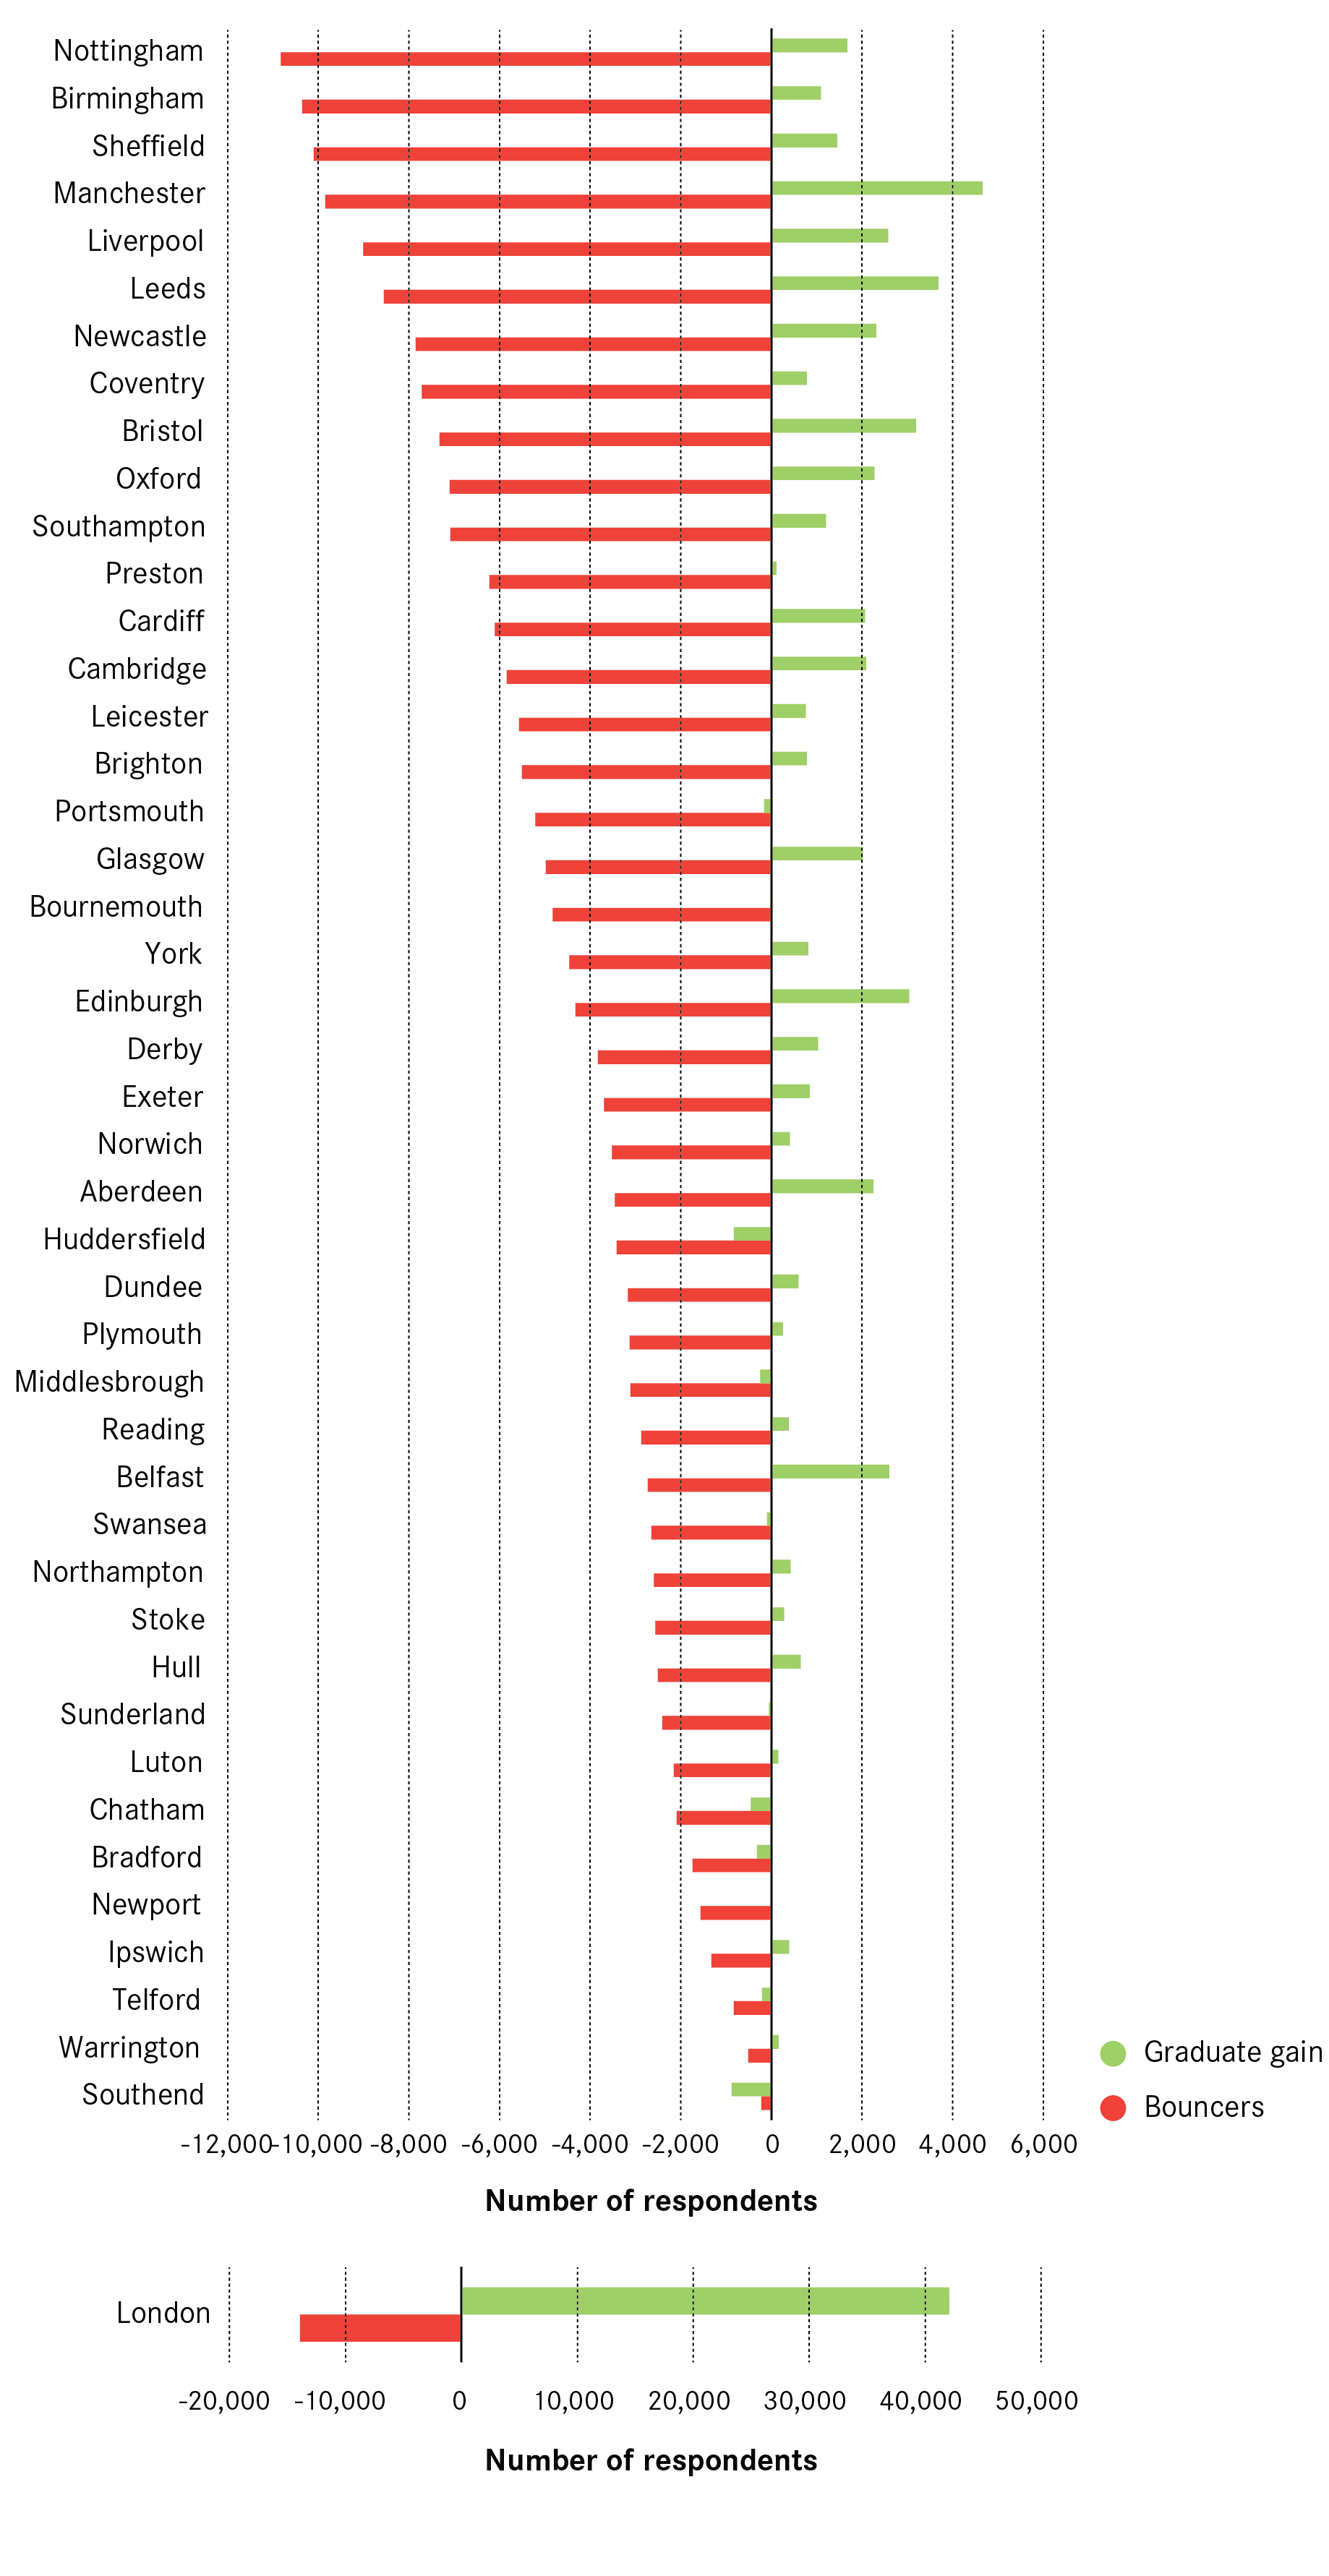
Box 3: City case studies
Nottingham – attracting students and losing graduates
In the 2013-2015 period 88 per cent of Nottingham student population came from elsewhere and both its universities were equally successful in attracting students. 14 per cent of the students not originally from Nottingham came from London. However, Nottingham is not so successful in retaining graduates. Only 21 per cent of its graduates remained in Nottingham to work. Whereas 66 per cent of the students originally from Nottingham stayed to work, only 14 per cent of the students who came from elsewhere to study remained to work in Nottingham. In particular, Nottingham loses graduates to London and it is the largest contributor to London’s graduate population.
Sheffield – attracting students and keeping graduates
Sheffield is another city that attracts a large number of students from other parts of the country, but it is also successful in retaining a considerable share of its graduates. In the 2013-2015 period, 81 per cent of its students were not from Sheffield. Unlike Nottingham, Sheffield retains a substantial share of its graduates – 31 per cent of its students remain in Sheffield to work. 75 per cent of the students who were living in Sheffield before university worked in the city after graduation, whereas 20 per cent of the graduates who came from elsewhere to study remained in Sheffield to work. Like Nottingham and many other cities, Sheffield loses students to London. But the share of graduates who moved to London is only 10 per cent.
Leeds – Attracting students, attracting graduates
Leeds also gains large number of students. In the 2013-2015 period 86 per cent of its students were not originally from Leeds. 29 per cent of Leeds graduates remained in the city for work. The share of graduates that moved to Leeds to study and stayed in the city to work is 23 per cent, higher than Nottingham and Sheffield. The share of graduates who lived in Leeds before university and stayed in the city after graduation is 68 per cent. Leeds also loses a considerable amount of graduates to London – 15 per cent move to London for work, but 97 per cent of these lived elsewhere before university. However, Leeds also attracts graduates from other cities with 1.8 per cent of all moving graduates heading to the city, the fourth largest share among UK cities.
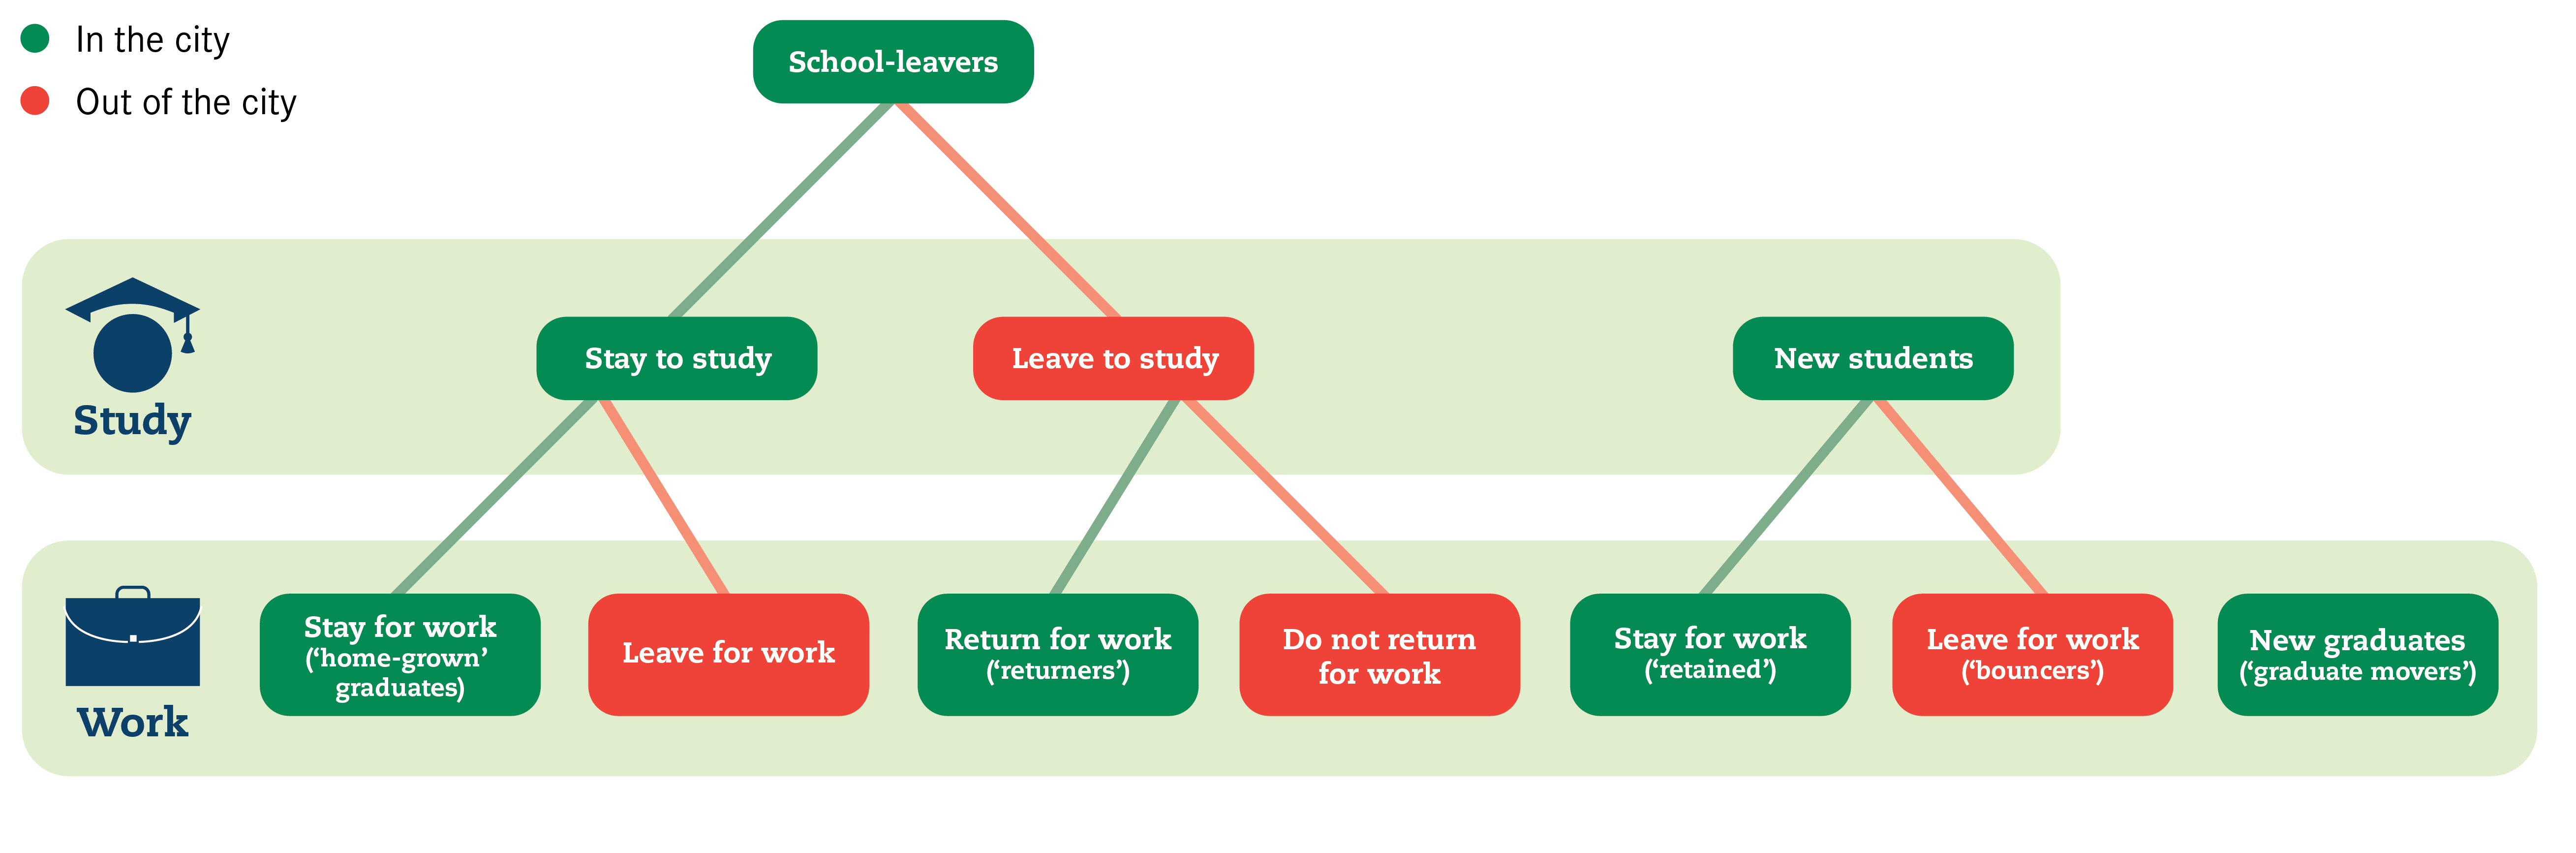
Movement of students and graduates in and out of a city
Universities help cities retain home-grown graduates. The final component of the new graduate labour force in cities is the ‘home-grown’ element – those graduates who grow up, study and work in the same city. There is large variation in the significance of these home-grown graduates across cities. In London, they made up half of the new graduate workforce. In large cities this share was 38 per cent, while it fell to 21 per cent in medium cities and 12 per cent in small cities.
Cities without a university are least likely to attract back their students after they have graduated. Obviously cities without a university cannot benefit from the home-grown effect, as their students are forced to go elsewhere to study. They are also least likely to attract back their students after they have graduated. In cities such as Barnsley, Crawley and Basildon, less than one third of new working graduates grew up in these cities. This compares to three quarters of graduates in Birmingham, Manchester and Liverpool.
But having a university does not guarantee that a city will see a net gain in new graduates from elsewhere. As shown in Figure 15, 20 cities lost more graduates who grew up in their cities than they gained in graduates who grew up elsewhere. Amongst these were the university cities of Sunderland, Middlesbrough, Portsmouth, Bradford and Huddersfield. Meanwhile cities such as Milton Keynes, Swindon and Crawley, all of which do not have a campus university, experienced a graduate gain, so that the number of new graduates attracted in to work was bigger than the outflow of students moving to other cities to study.
Overall universities pull students into cities. The overall outcome for cities from these student and graduate movements is shown in Figure 17. The movements of the ‘bouncers’ meant that large, medium and small cities all had a smaller share of working graduates than students at their universities. But this share was still greater than their shares of students originally from these cities.
Figure 17: The distribution of where students live, where they study and where they move to after graduation, 2013/14 – 2014/15

Box 4: The composition of cities’ new graduate workforces
The chart below provides a detailed breakdown of the components of the new graduate workforce for every city.
The components of the new graduate workforce, 2013/14-2014/15

Source: HESA destination of leavers survey
Summary
- Graduate migration is driven by students who ‘bounce’ – those who move into a city to study, but leave on graduation to work somewhere else. It is not that cities outside London do not retain graduates; it is that they do not retain the majority of those students that move to their city to study.
- The brain drain to London is not just about quantity, but about composition too. London pulls in many more graduates than its share of jobs would suggest, and this is even more prominent for high achievers from Russell Group universities.
- All university cities retain at least a small share of graduates who moved to the city to study, which means that when these are added to the home-grown graduates, most cities experience a graduate gain, despite losing large numbers of students upon graduation.
- Universities do help cities to develop and retain graduates who grew up in the city, but having a university does not guarantee that a city will see a graduate gain. A number of university cities see a graduate loss, while a number of cities without a university see a graduate gain.
There are a number of factors that influence the decisions made by graduates as to which cities to live and work in. The next section explores the relationship between graduate location decisions and the factors commonly identified as influencing those decisions.