03A more detailed look at the movement of students and graduates
The data above suggests that universities play a large role in the movements of people to and from Newcastle. This section explores the specific migration patterns of students and graduates into and out of the city using two data sets from the Higher Education Statistics Authority (HESA). The first looks at admissions (for all students at university in 2014/15 including international students), and the second is based on a survey of graduates six months after graduation (for leavers in 2013/14 and 2014/15) but only includes domestic students. Unlike the ONS data used above it covers the whole of the UK.
Box 1: Higher education institutions in Newcastle
This analysis covers Newcastle’s two universities: Newcastle University and Northumbria University. In the academic year 2014/15 there were 40,181 students enrolled at these universities, 41 per cent at Newcastle University and 59 per cent at Northumbria.
Subjects studied by students varied across the two universities. Of those graduating from Newcastle University, 18 per cent studied medicine or dentistry, 11 per cent engineering, 9 per cent business and 9 per cent social studies. At Northumbria University 20 per cent of graduates studied subjects related to medicine, such as nursing. 11 per cent studied business, 11 per education, 10 per cent biological sciences and 9 per cent creative arts and design.
Movements to university
Newcastle’s universities have a strong regional and international pull
In the academic year 2014/15, 37 per cent of Newcastle’s university students were originally from the North East region and 17 per cent were from the city itself. As Figure 8 shows, other popular UK origins of students were Yorkshire and the North West.
There was a considerable number of international students, who accounted for 20 per cent of all students in the city. EU students accounted for 3 per cent of all students in Newcastle, and 15 per cent of international students. Any future changes to immigration policy, for example due to Brexit, is likely to affect the make-up of Newcastle’s university student body.
Figure 8: Origins of Newcastle’s university students, 2014/15

Looking specifically at the cities students came from, most were from cities neighbouring Newcastle: 4 per cent of the students who moved to Newcastle for university were from Sunderland, 3 per cent were from Middlesbrough and another 3 per cent were from Leeds. The capital was also a popular origin, with 4 per cent of those moving to Newcastle from London.
Figure 9: Origin cities of those students who moved to Newcastle for university, 2014/15

However, these patterns differed by institution. Newcastle university had a much wider pull than Northumbria university whose students were mainly local. International students made up 29 per cent of Newcastle University’s student population, as shown in Figure 10, compared with 19 per cent coming from the North East region including 12 per cent from Newcastle itself. Other popular origins of students were Yorkshire (11 per cent) and the North West (10 per cent).
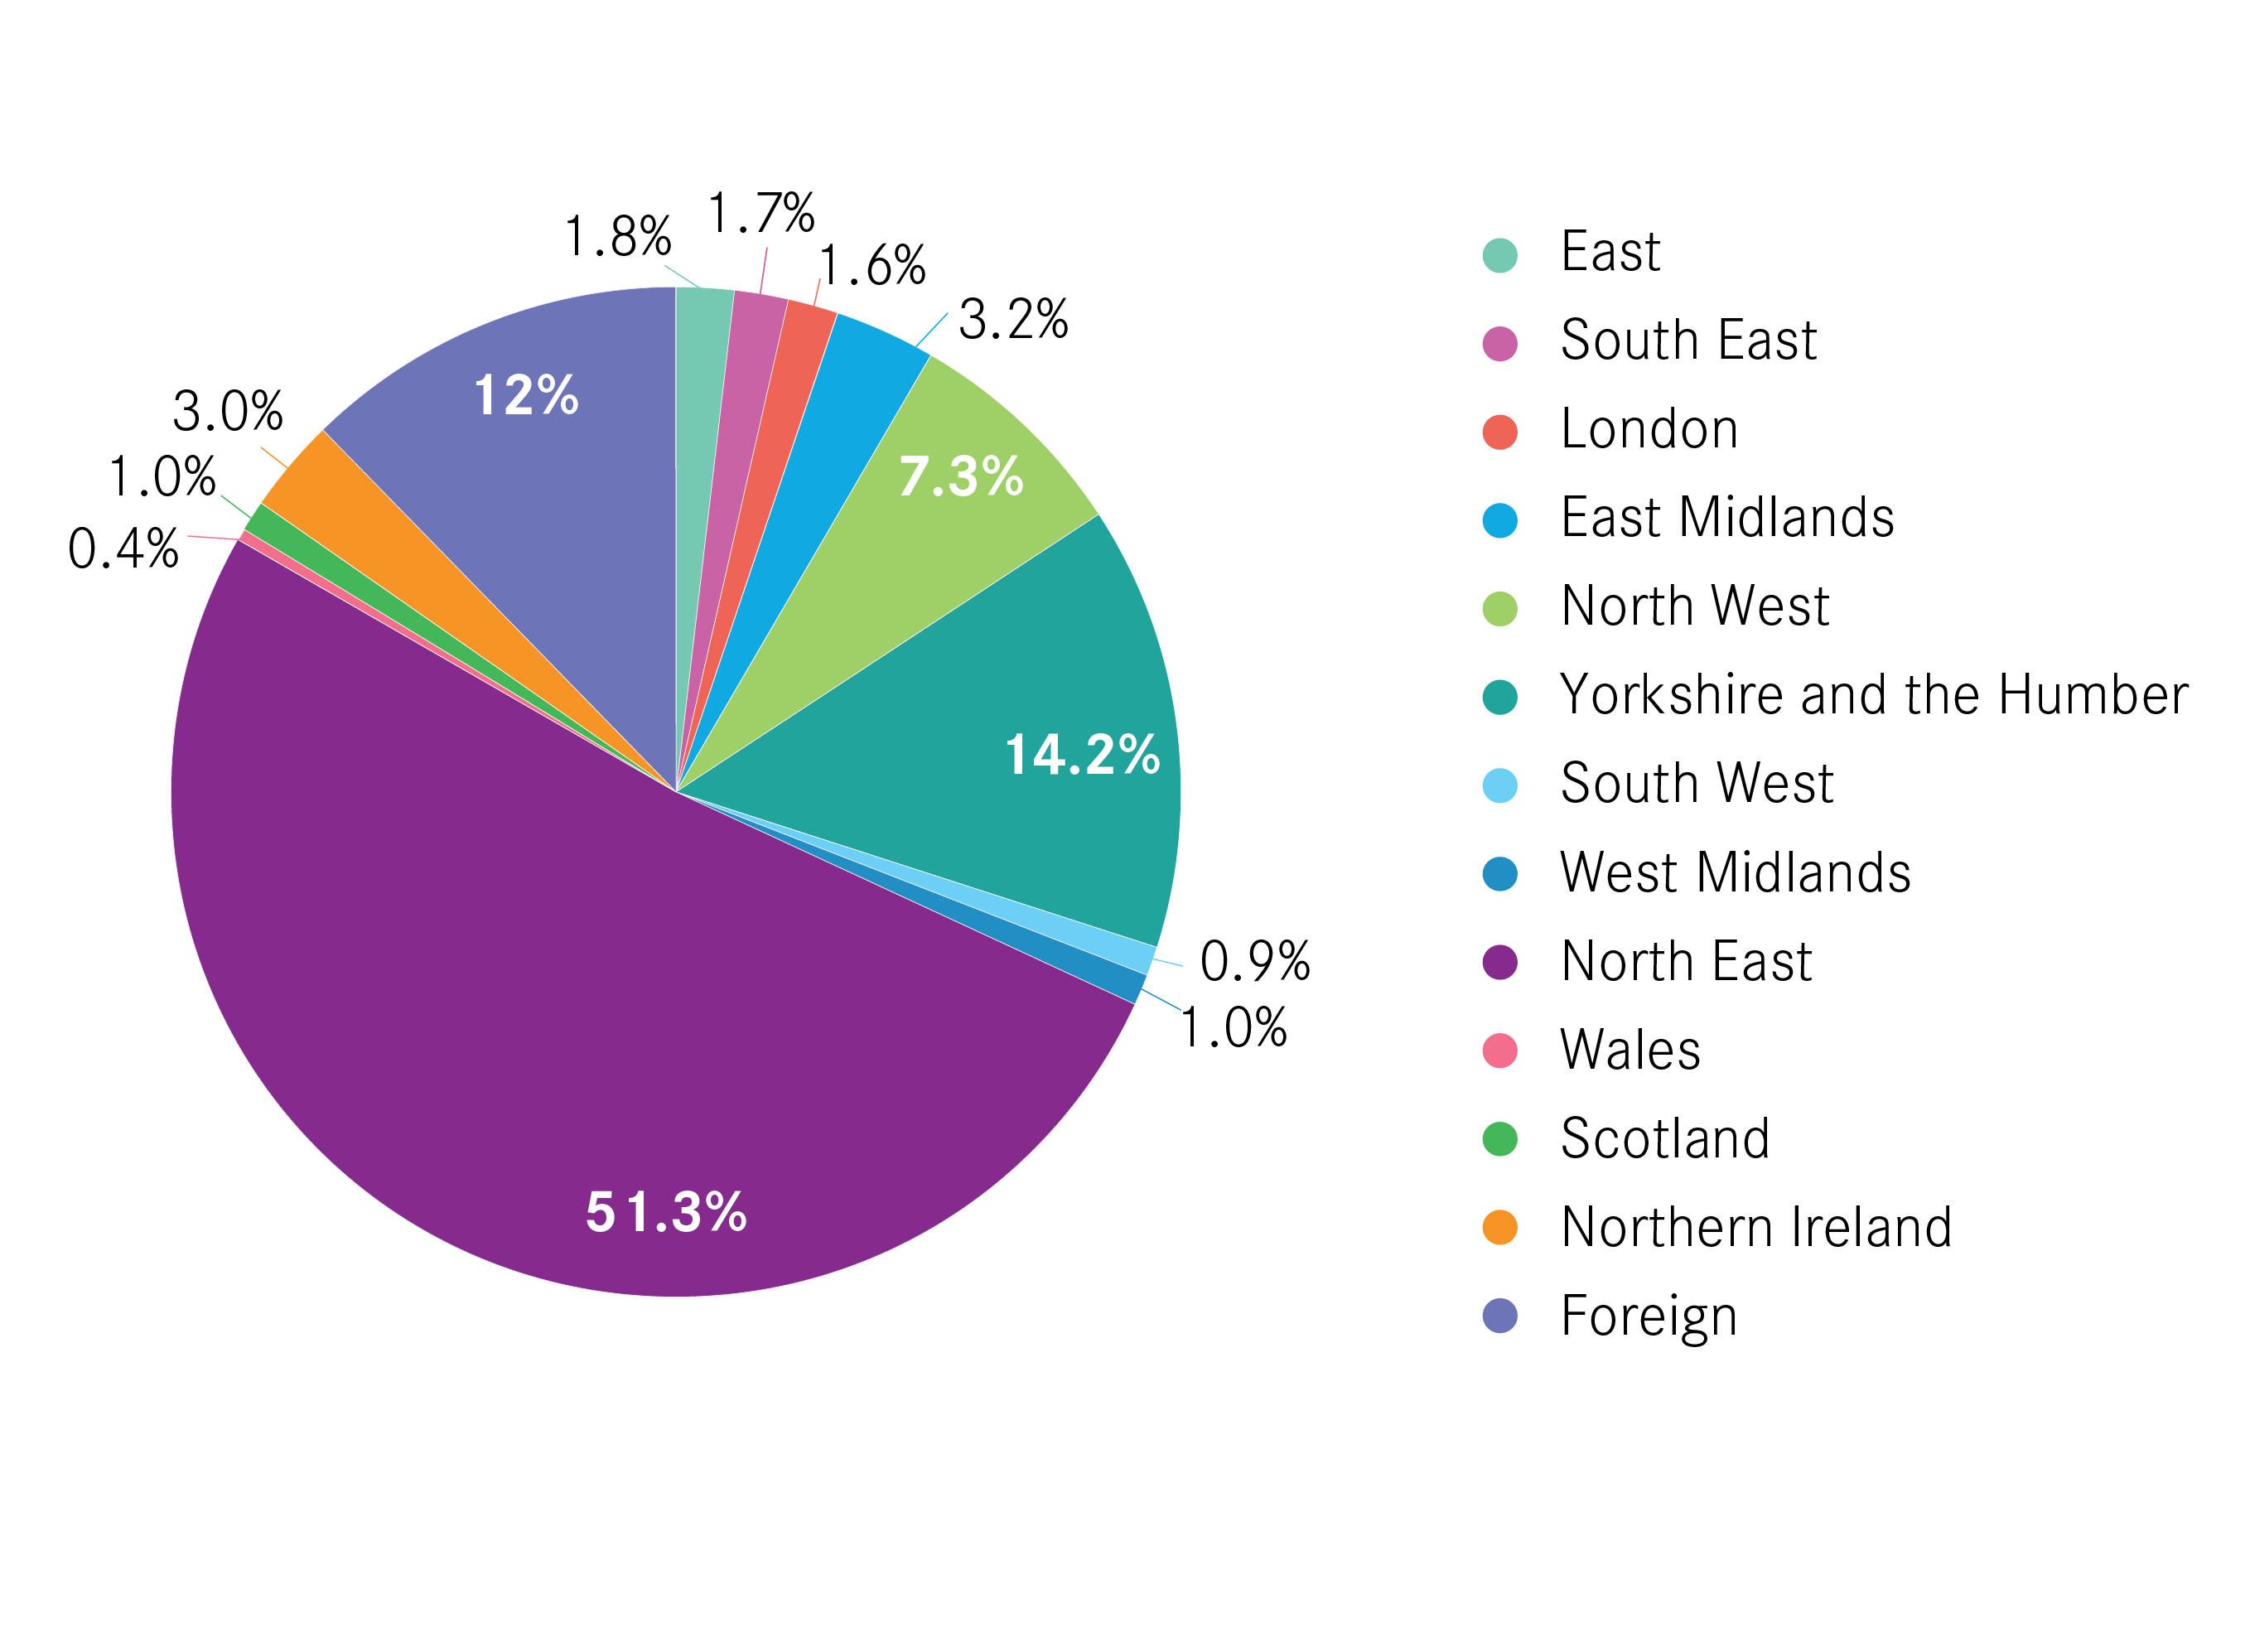
In contrast, 51 per cent of those at Northumbria University were from the North East, as shown in Figure 11, with 27 per cent from the city itself. In addition to this local pull, 12 per cent of students at the university were international. Yorkshire and the North West were again popular origins of students, contributing 14 per cent and 7 per cent respectively of students at Northumbria.
Figure 10: Origin of students at Newcastle University, 2014/15
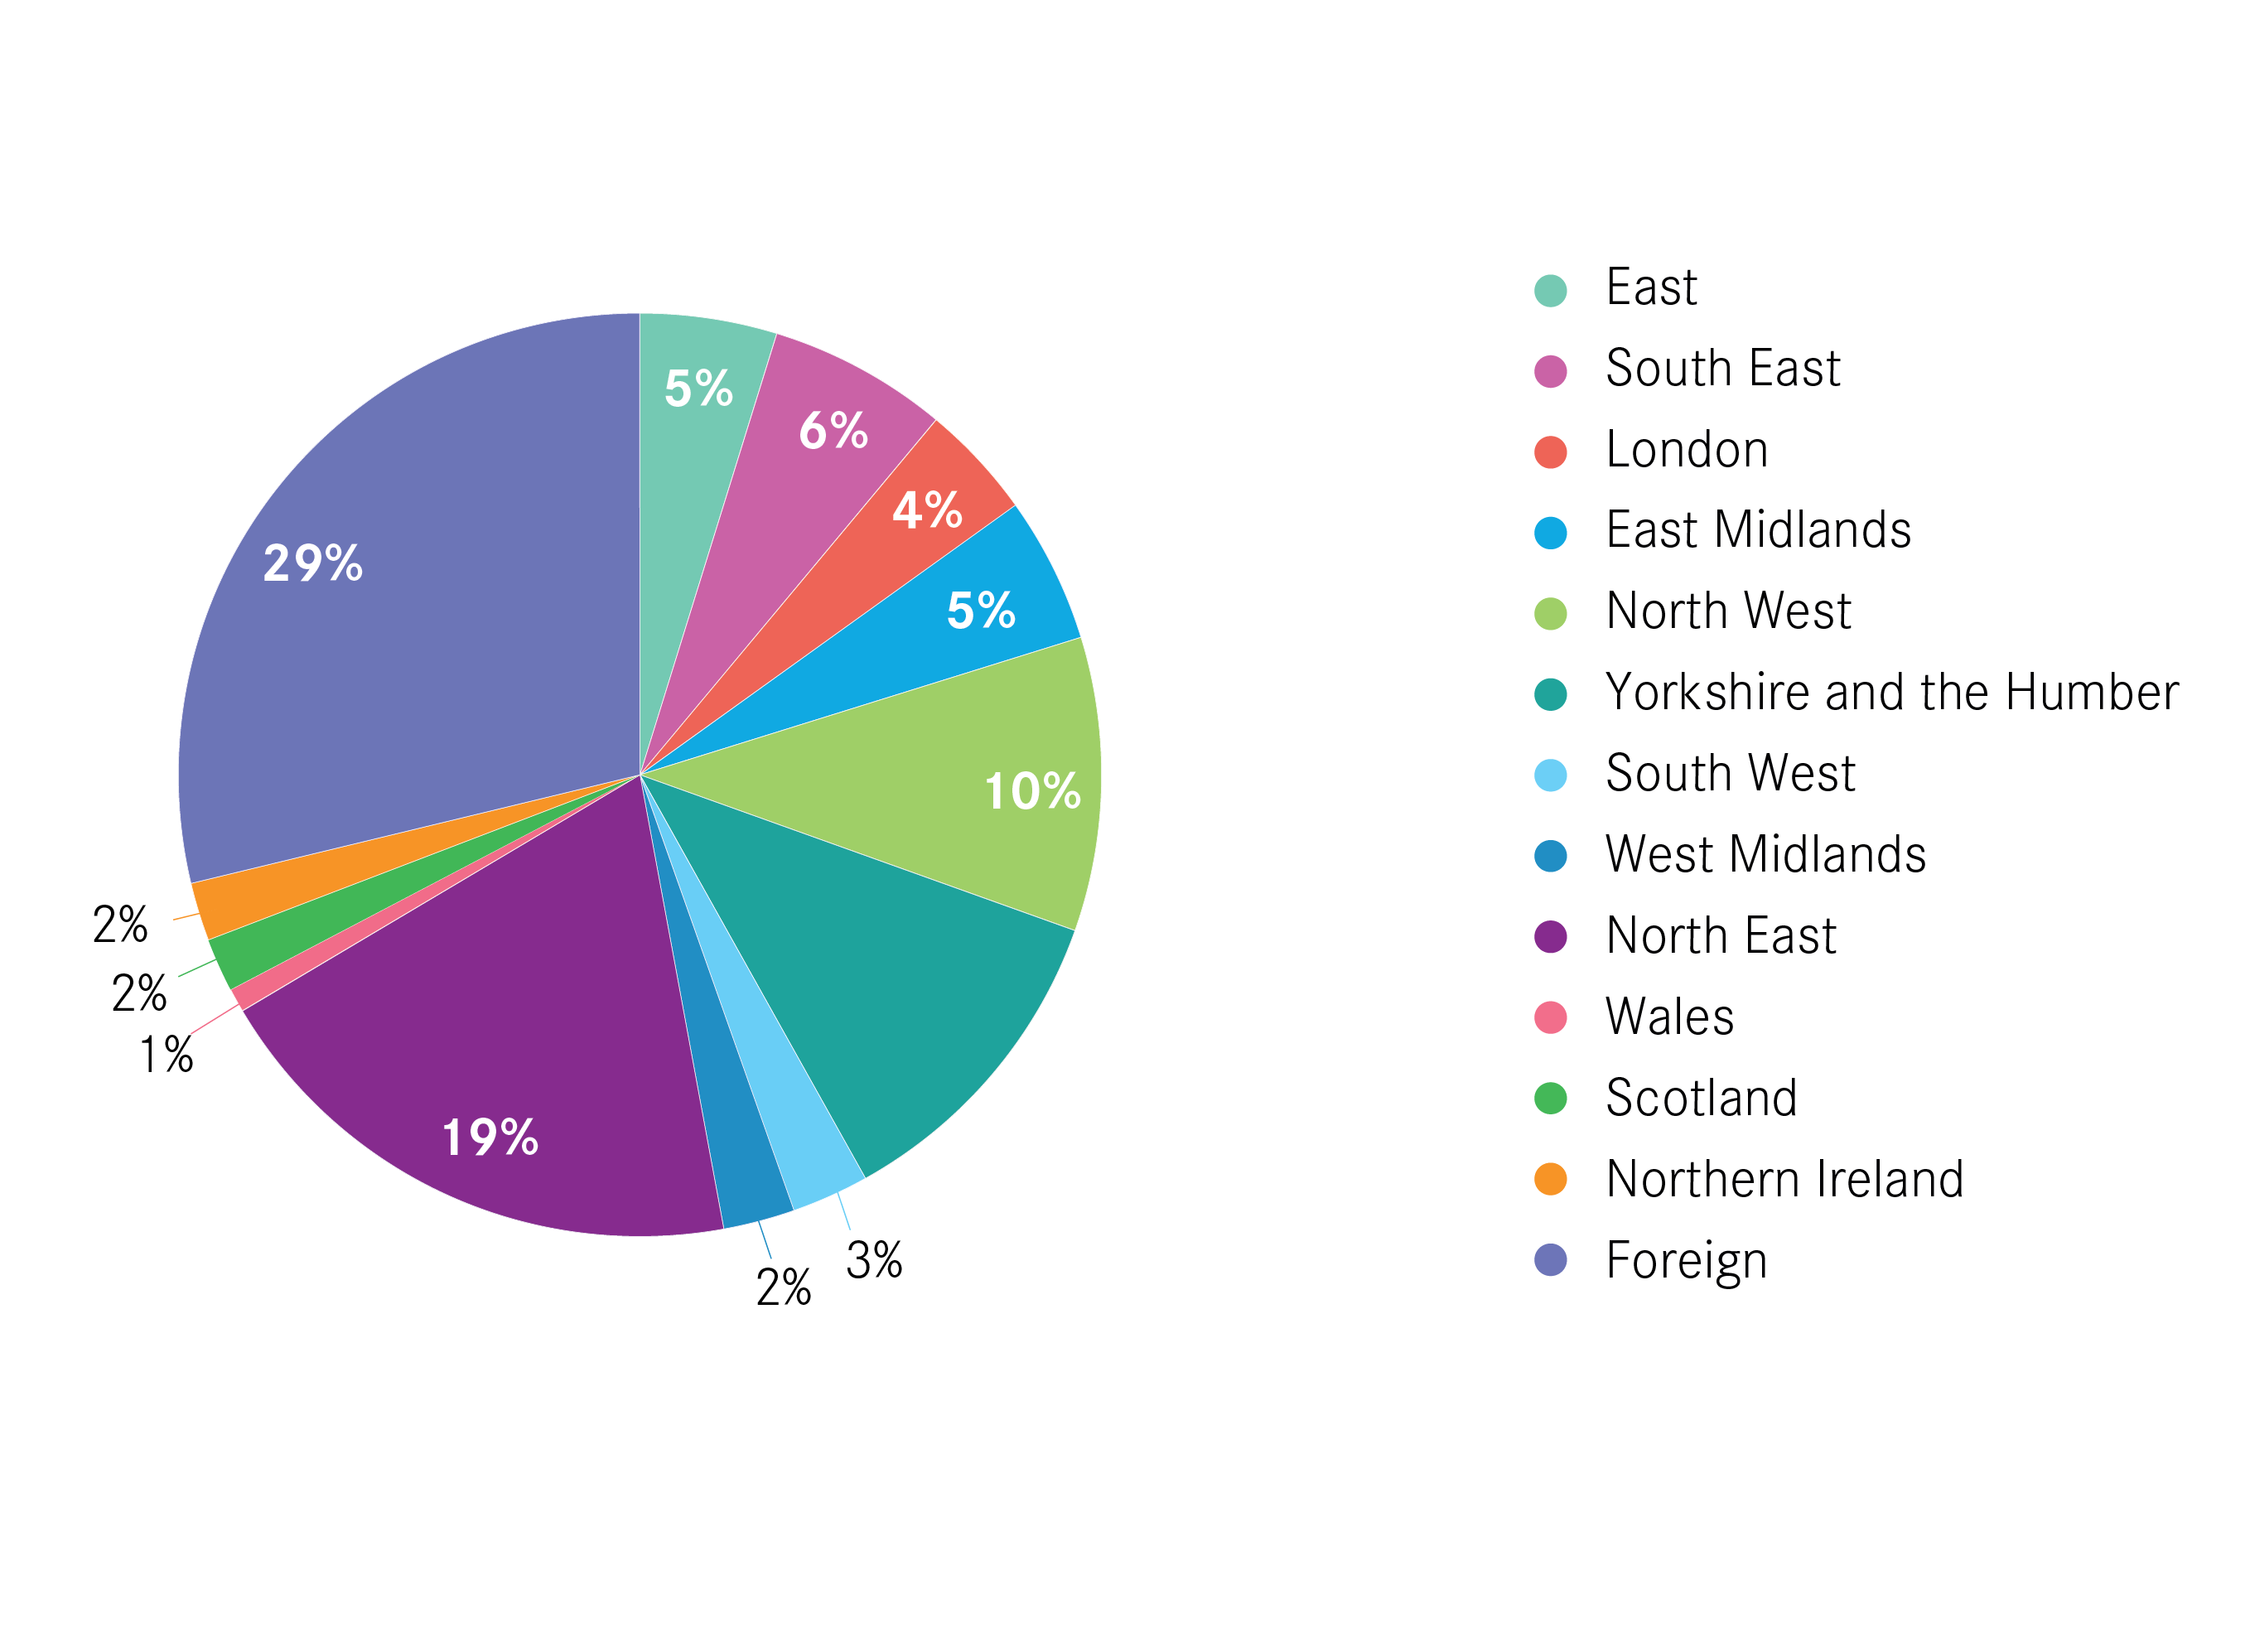
Figure 11: Origin of students at Northumbria University, 2014/15
Students who move away from Newcastle for university choose to stay in the North East
The most popular university destination of those who left the city was to stay in the North East region, as shown in Figure 12. Of those who moved out of Newcastle, 27 per cent went to Sunderland for university. Other cities attracting Newcastle students were Middlesbrough (8 per cent), Leeds (8 per cent) and London (7 per cent).
Figure 12: Destination regions of those moving away from Newcastle for university, 2014/15
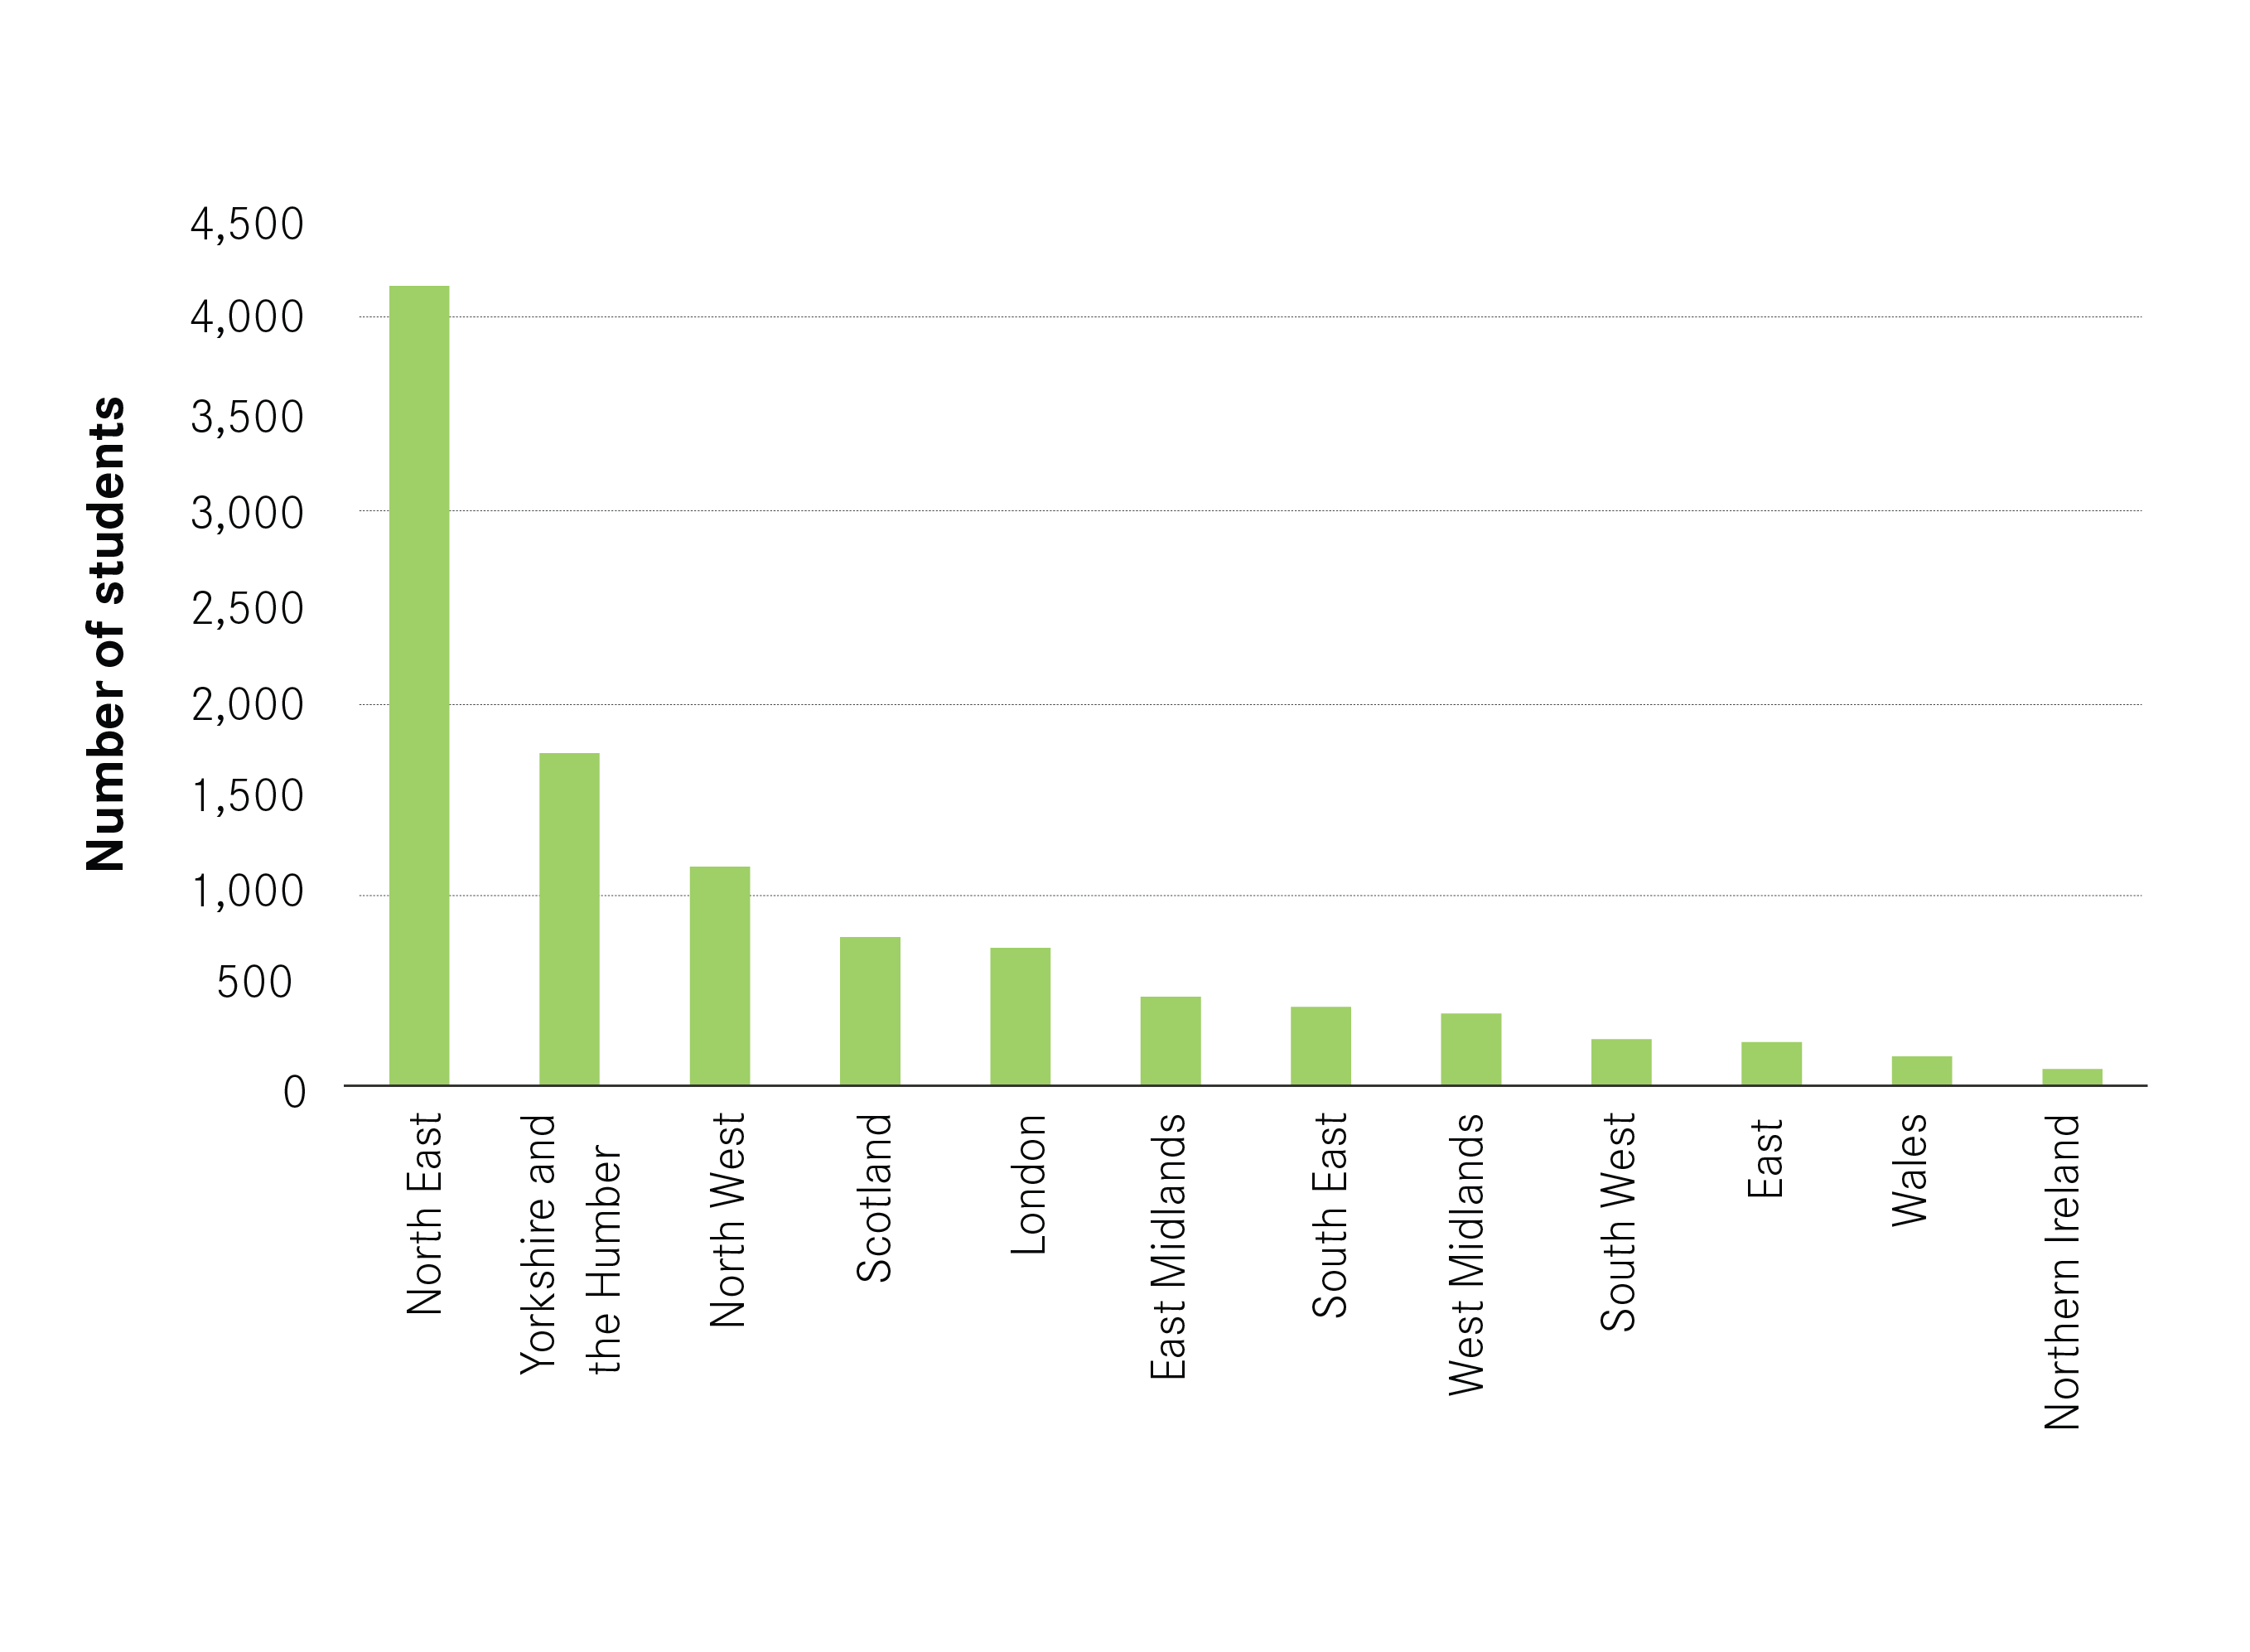
Figure 13: Destination cities of Newcastle students moving away for university, 2014/15

Overall Newcastle gains more domestic university students than it loses
In the academic year 2014/15, 31,620 students in Newcastle were originally from outside the city, but within the UK, and 10,560 students originally from Newcastle were studying elsewhere in the UK. As a result, there was a net gain to the city of 21,060 students. This finding is in-line with the net inflows of 16 to 21 year olds to city, shown in Figure 7.
Movements of new graduates post-university6
Newcastle has a high retention rate
After graduation more than a third of Newcastle’s students stay to work in the city. This was the 9th highest retention rate of all UK cities, placing it amongst other large cities as shown in Figure 14. In comparison, London and Manchester retained 77 per cent and 51 per cent, respectively, of their new graduates. At the other end of the scale, Chatham and Exeter only retained 12 per cent and 13 per cent of new graduates.
Figure 14: Retention rates of each UK city, 2013/14 – 2014/15

However, the city’s two universities had very different retention rates. Six months after graduation, 26 per cent of Newcastle University graduates were working in the city. In comparison, as shown in Figure 15, 40 per cent of graduates from Northumbria University had stayed.
One reason for this difference is the tendency of Northumbria students to be from the local area. As shown above, half of the university’s students were from the region and local students are more likely than others to remain in the city on graduation given their home ties. Figure 16 shows that 52 per cent of the university’s graduates who stayed in the city grew up there. In contrast, only 31 per cent of Newcastle University’s retained graduates were originally from the city.
This suggests that retention rates are likely to be driven by the regional focus of a city’s institutions. By implication, Newcastle University’s more diverse student population is likely to be part of the reason for its lower retention rate.
Figure 15: Percentage of graduates retained in Newcastle post-graduation, 2013/14 – 2014/15

Figure 16: Proportion of all retained students from Newcastle itself and elsewhere, 2013/14 – 2014/15

This relationship also exists at a city level. Figure 17 shows that cities with high retention rates tend to have a higher share of local students. However, for some cities this relationship is not as strong: Edinburgh and Aberdeen have high retention rates without a high share of local students. A distinction can therefore be made between cities which retain graduates due to a strong local focus, and those which retain graduates despite their diverse student base. Newcastle is one of the latter cities, more similar to Edinburgh than Middlesbrough; it retains a quarter of all students who were not originally from the city, one of the highest rates of all UK cities.
Figure 17: Relationship between retention and local students, 2013/4 -2014/5

Retention rates also vary by subject, as shown in Figure 18. Of those studying subjects related to medicine, 56 per cent stayed in Newcastle for work after university. Almost half of computer science graduates (45 per cent) stayed in the city and the retention rate for those studying education was 46 per cent.
The high number of retained medical students was driven by Northumbria University. 20 per cent of its graduates studied subjects related to medicine, and 61 per cent of these graduates then chose to remain in Newcastle on graduation. For computer science and education the retention rates of students did not vary much across the two institutions.
Figure 18: Retention rate of students studying each subject, 2013/14 – 2014/15

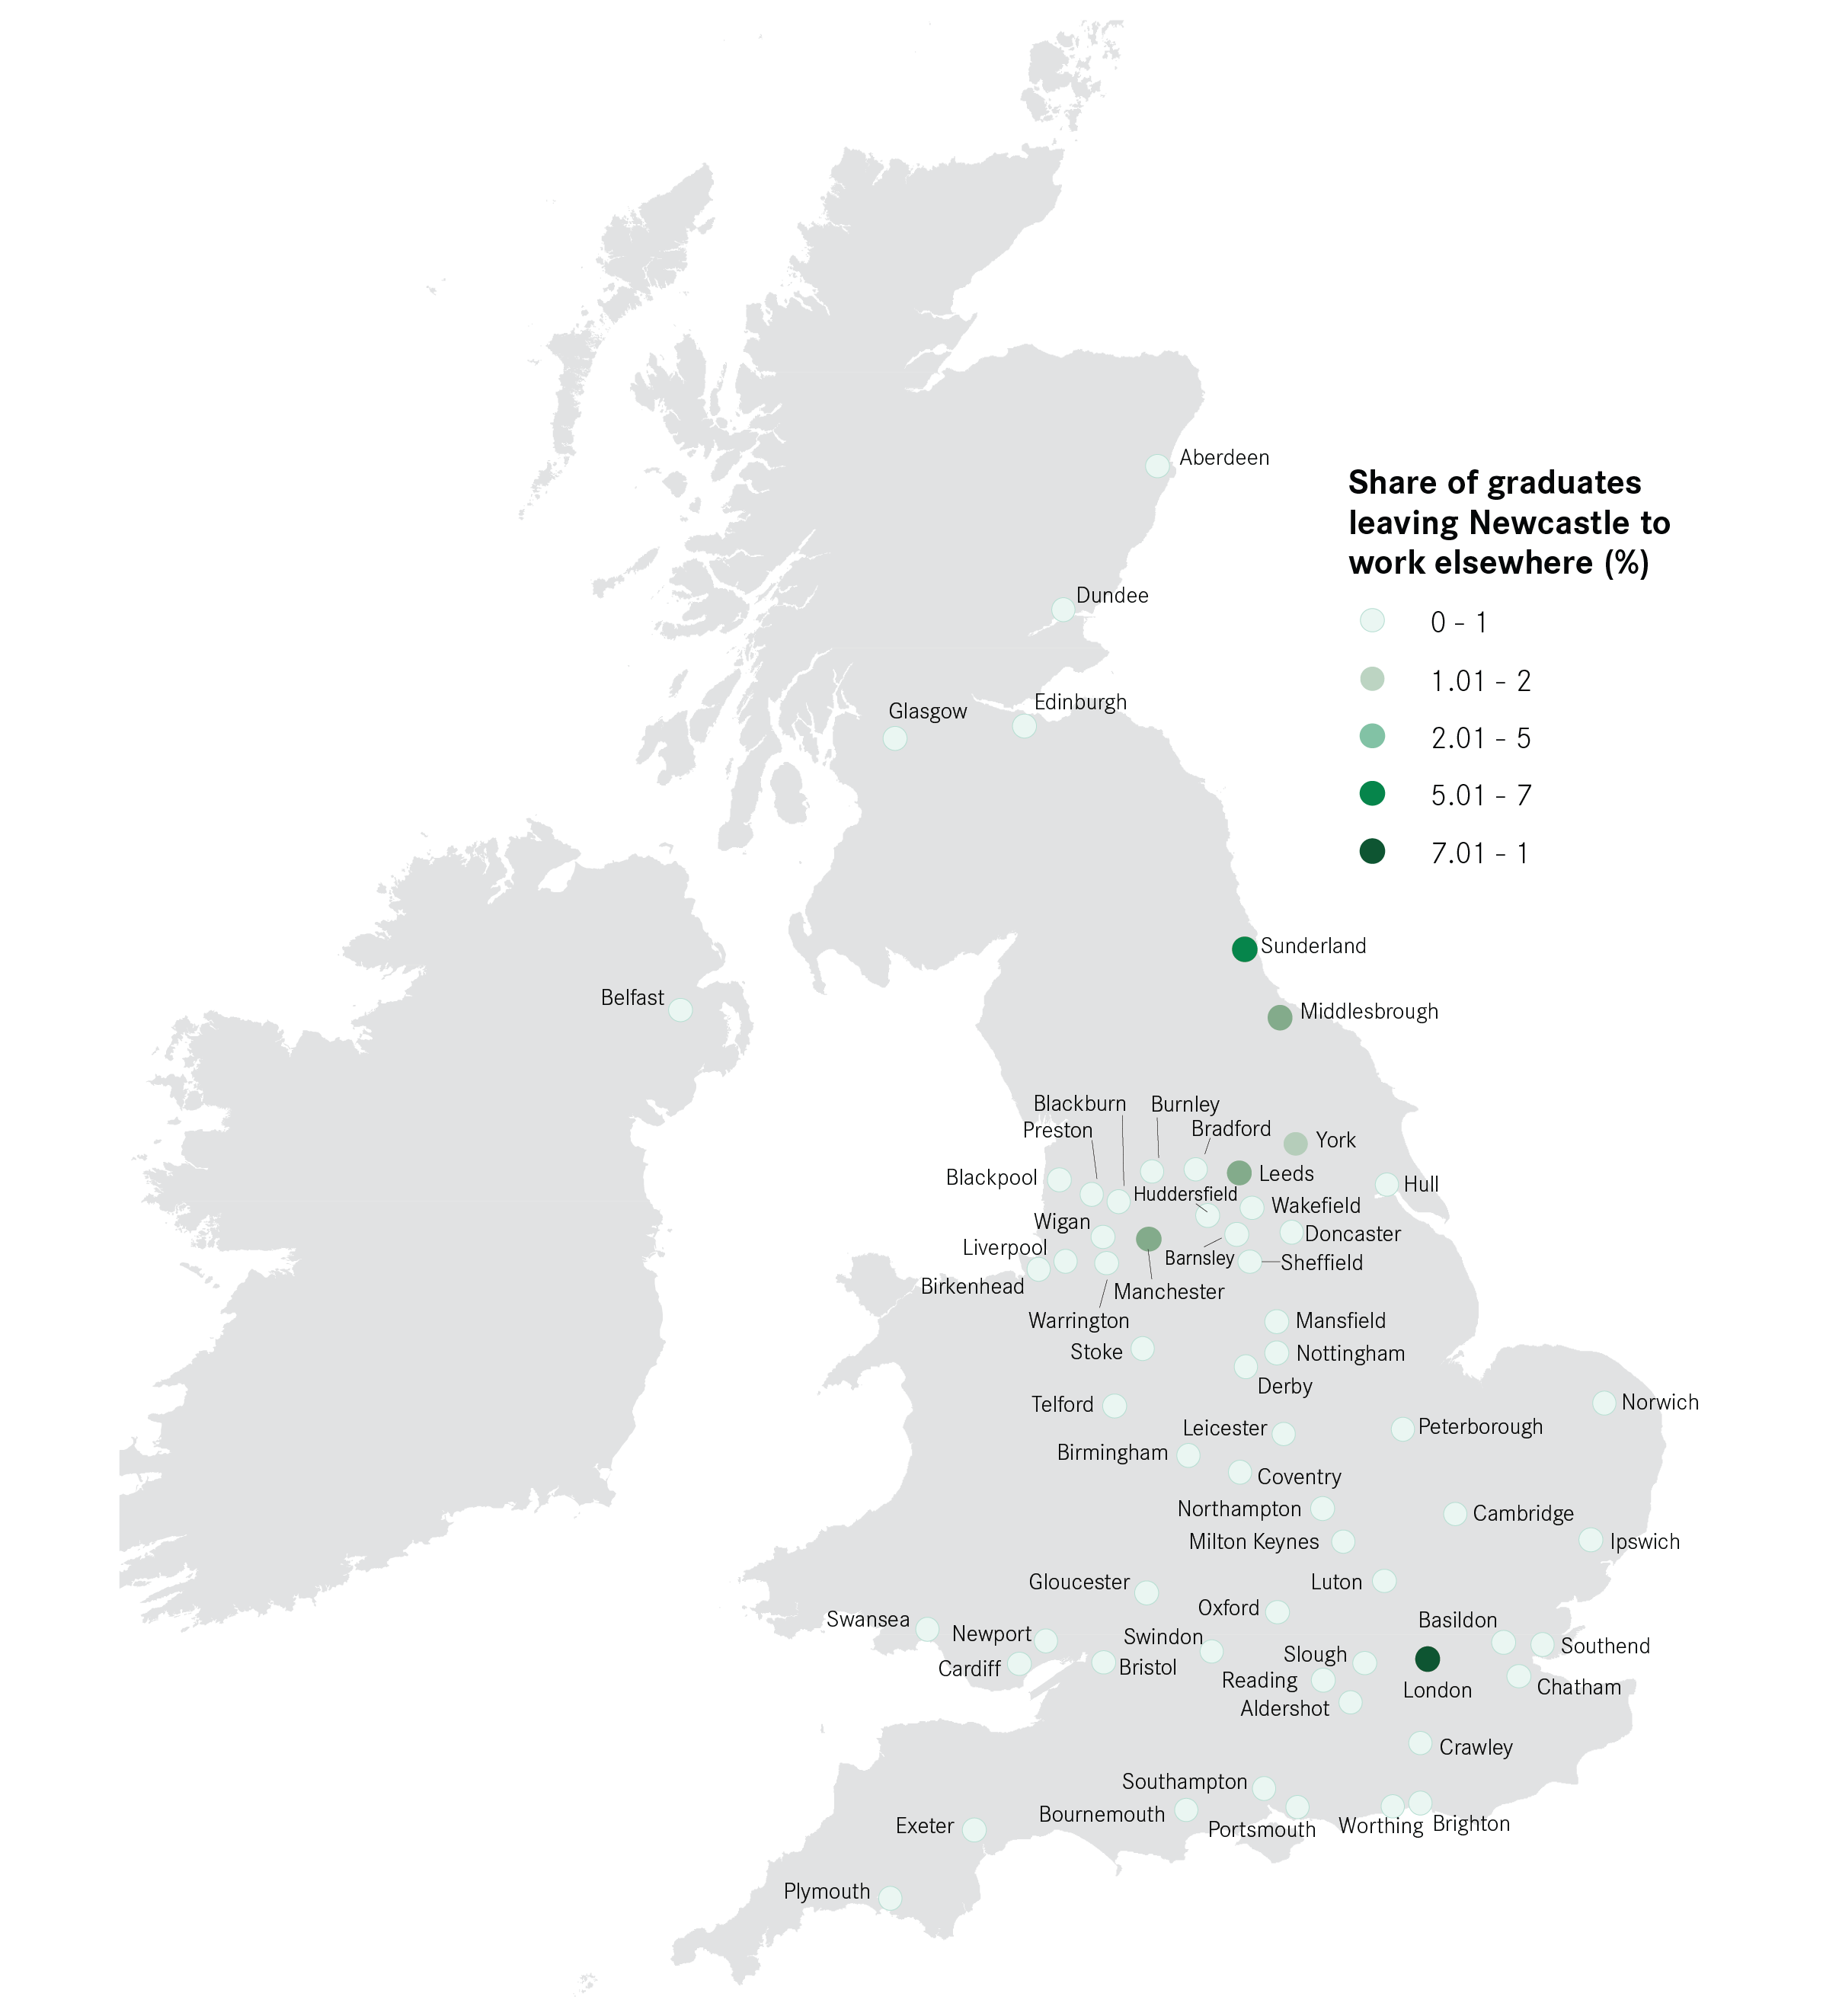
London is the most popular destination of graduates who leave Newcastle
Of the two-thirds of graduates who left Newcastle on graduation, 17 per cent chose to work in London, as shown in Figure 19. The attraction of the capital is not unique to Newcastle graduates; our research shows that the capital is a popular destination for graduates across the UK, especially those with 1st or upper second class degrees from Russell Group universities.
Nearby cities were also popular destinations. Many stayed within the North East, with 7 per cent moving to Sunderland and 5 per cent to Middlesbrough. Looking slightly further afield, 5 per cent moved to Leeds and 4 per cent to Manchester.
Figure 19: Destinations of Newcastle graduates who move to other cities for work, 2013/14 – 2014/15
Strong home ties mean many graduates return home to Newcastle
Half of those who leave Newcastle for university return on graduation. This means that Newcastle had the 5th highest return rate of UK cities. This finding is common to large cities: on average 51 per cent of leavers returned home to large cities. London attracted even more home, with 74 per cent of leavers returning to the capital on graduation.
Overall Newcastle gains graduates
Despite the outflow of many graduates to other parts of the UK after university, the number of non-local graduates in Newcastle outweighed the number of local graduates who left the city to work elsewhere. Therefore, the city gained graduates overall.
As shown in Figure 20, there were 2,260 surveyed graduates who grew up in Newcastle but left to study or work elsewhere (shown by the turquoise bar). On the other hand, the city gained 4,580 of those surveyed from elsewhere, either when they moved into the city to study and stayed to work, or when they moved into the city for the first time after university (shown by the dark green bar). This resulted in a net gain of 2,320 of the graduates surveyed (shown by the light green bar).
This is the 8th highest graduate gain of all UK cities. London gained the greatest number of surveyed graduates, 42,070, and Manchester followed with 4,660. Large UK cities gained on average 2,520 surveyed graduates, a very similar number to Newcastle.
Figure 20: Comparing students lost and graduates gained by Newcastle, 2013/14 – 2014/15

This data may not initially appear to be in-line with the earlier findings of a net outflow of young graduates from the city. This is because there is a final cohort of students, the ‘bouncers’ who are only temporarily in the city whilst at university. These students move into a city to study but leave straight after graduation. It was these bouncers who drove the outward migration patterns seen.
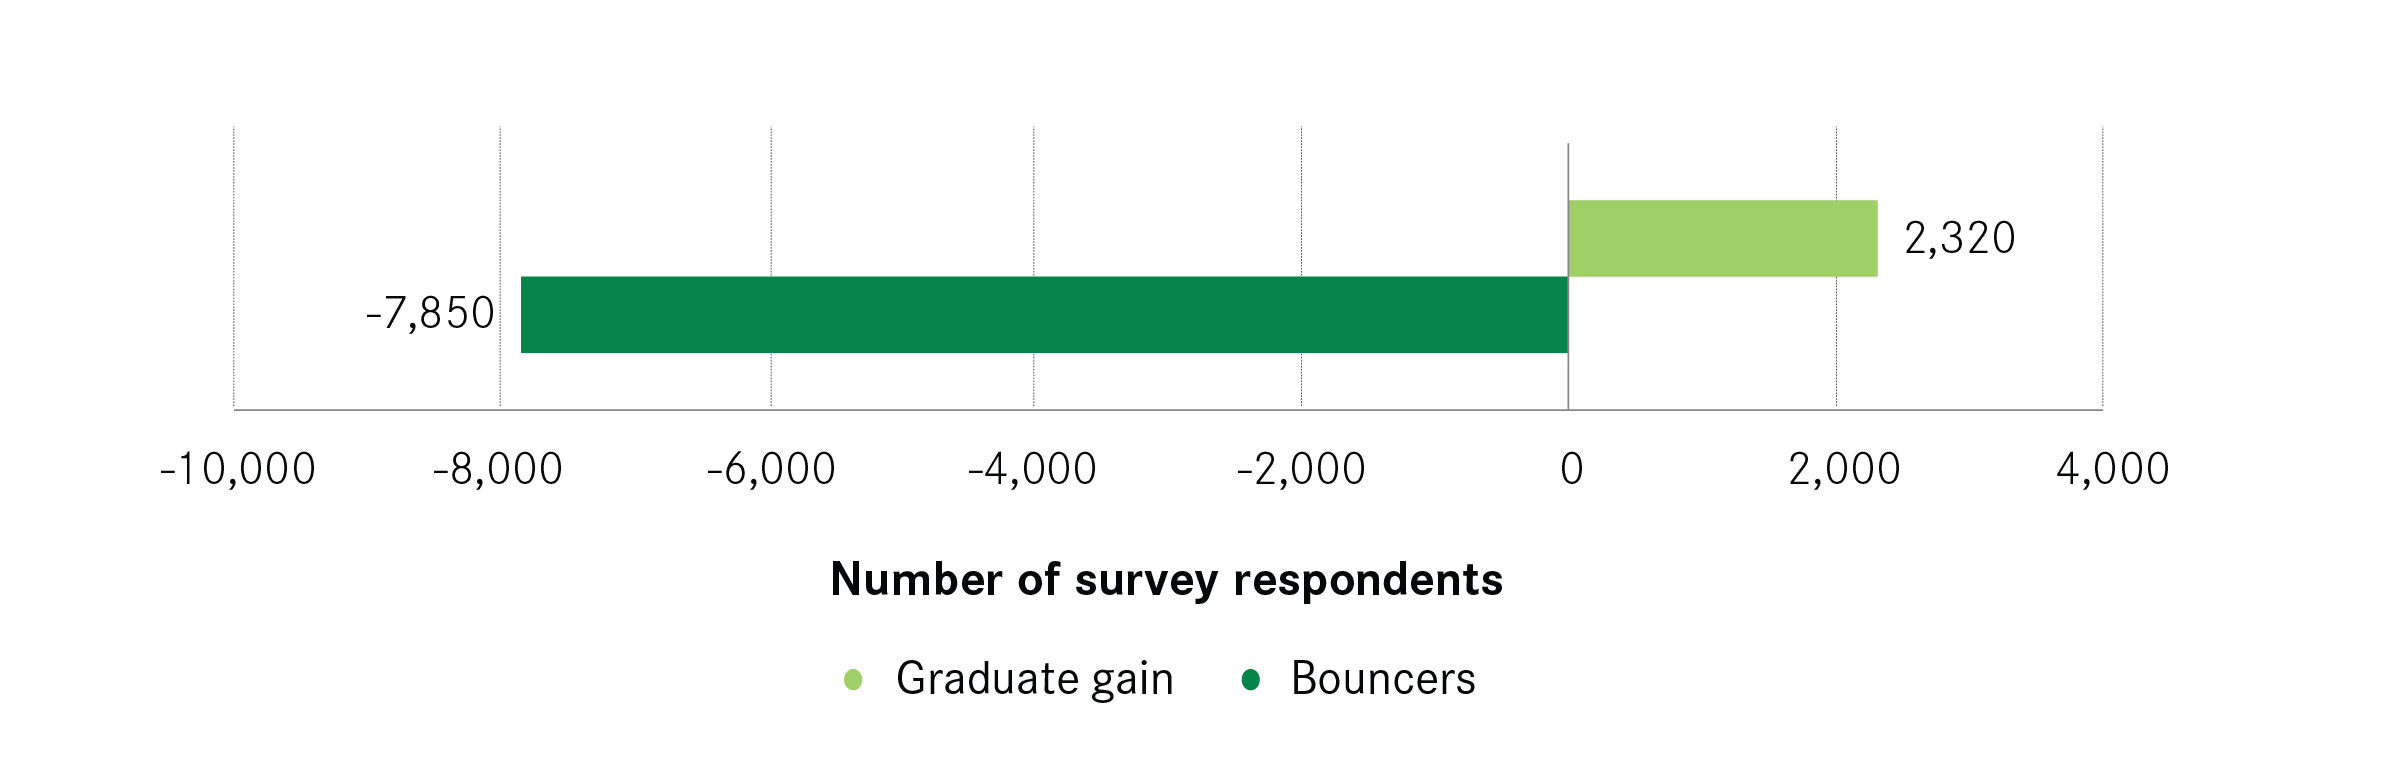
Of those who moved to Newcastle for university, 75 per cent left on graduation. Although this seems large, this is the 8th lowest proportion of all university cities. Figure 21 illustrates the size of this group: 7,850 surveyed graduates were ‘bouncers’ (shown by the dark green bar). This was a much larger number of graduates than those gained (shown by the light green bar), and so hides the fact that some students do stay on in the city to work.
Figure 21: The bouncers and the graduate gain, 2013/14 – 2014/15