
01Introduction
Youth unemployment has been a policy concern for decades because of the ‘scarring effects’ on individuals and the economy. Unemployment and underemployment are likely to limit the opportunities for young people to develop their skills.1 Young people that spend a period unemployed are likely to earn significantly less later in life than young people not unemployed, even after controlling for educational attainment, family background and place of residence.2 Estimates suggest a wage penalty by the age of 30/34 of between 16 and 17 per cent, based on an average length of unemployment.3 Lower wages and well-being are found to persist even 35 years after a prolonged period of youth unemployment, with the intensity of the scar increasing with the length of time unemployed.4 As well as the effects on individuals, prolonged periods of youth unemployment, coupled with significant underemployment, reduces levels of productivity and hinders the growth prospects for the UK economy.
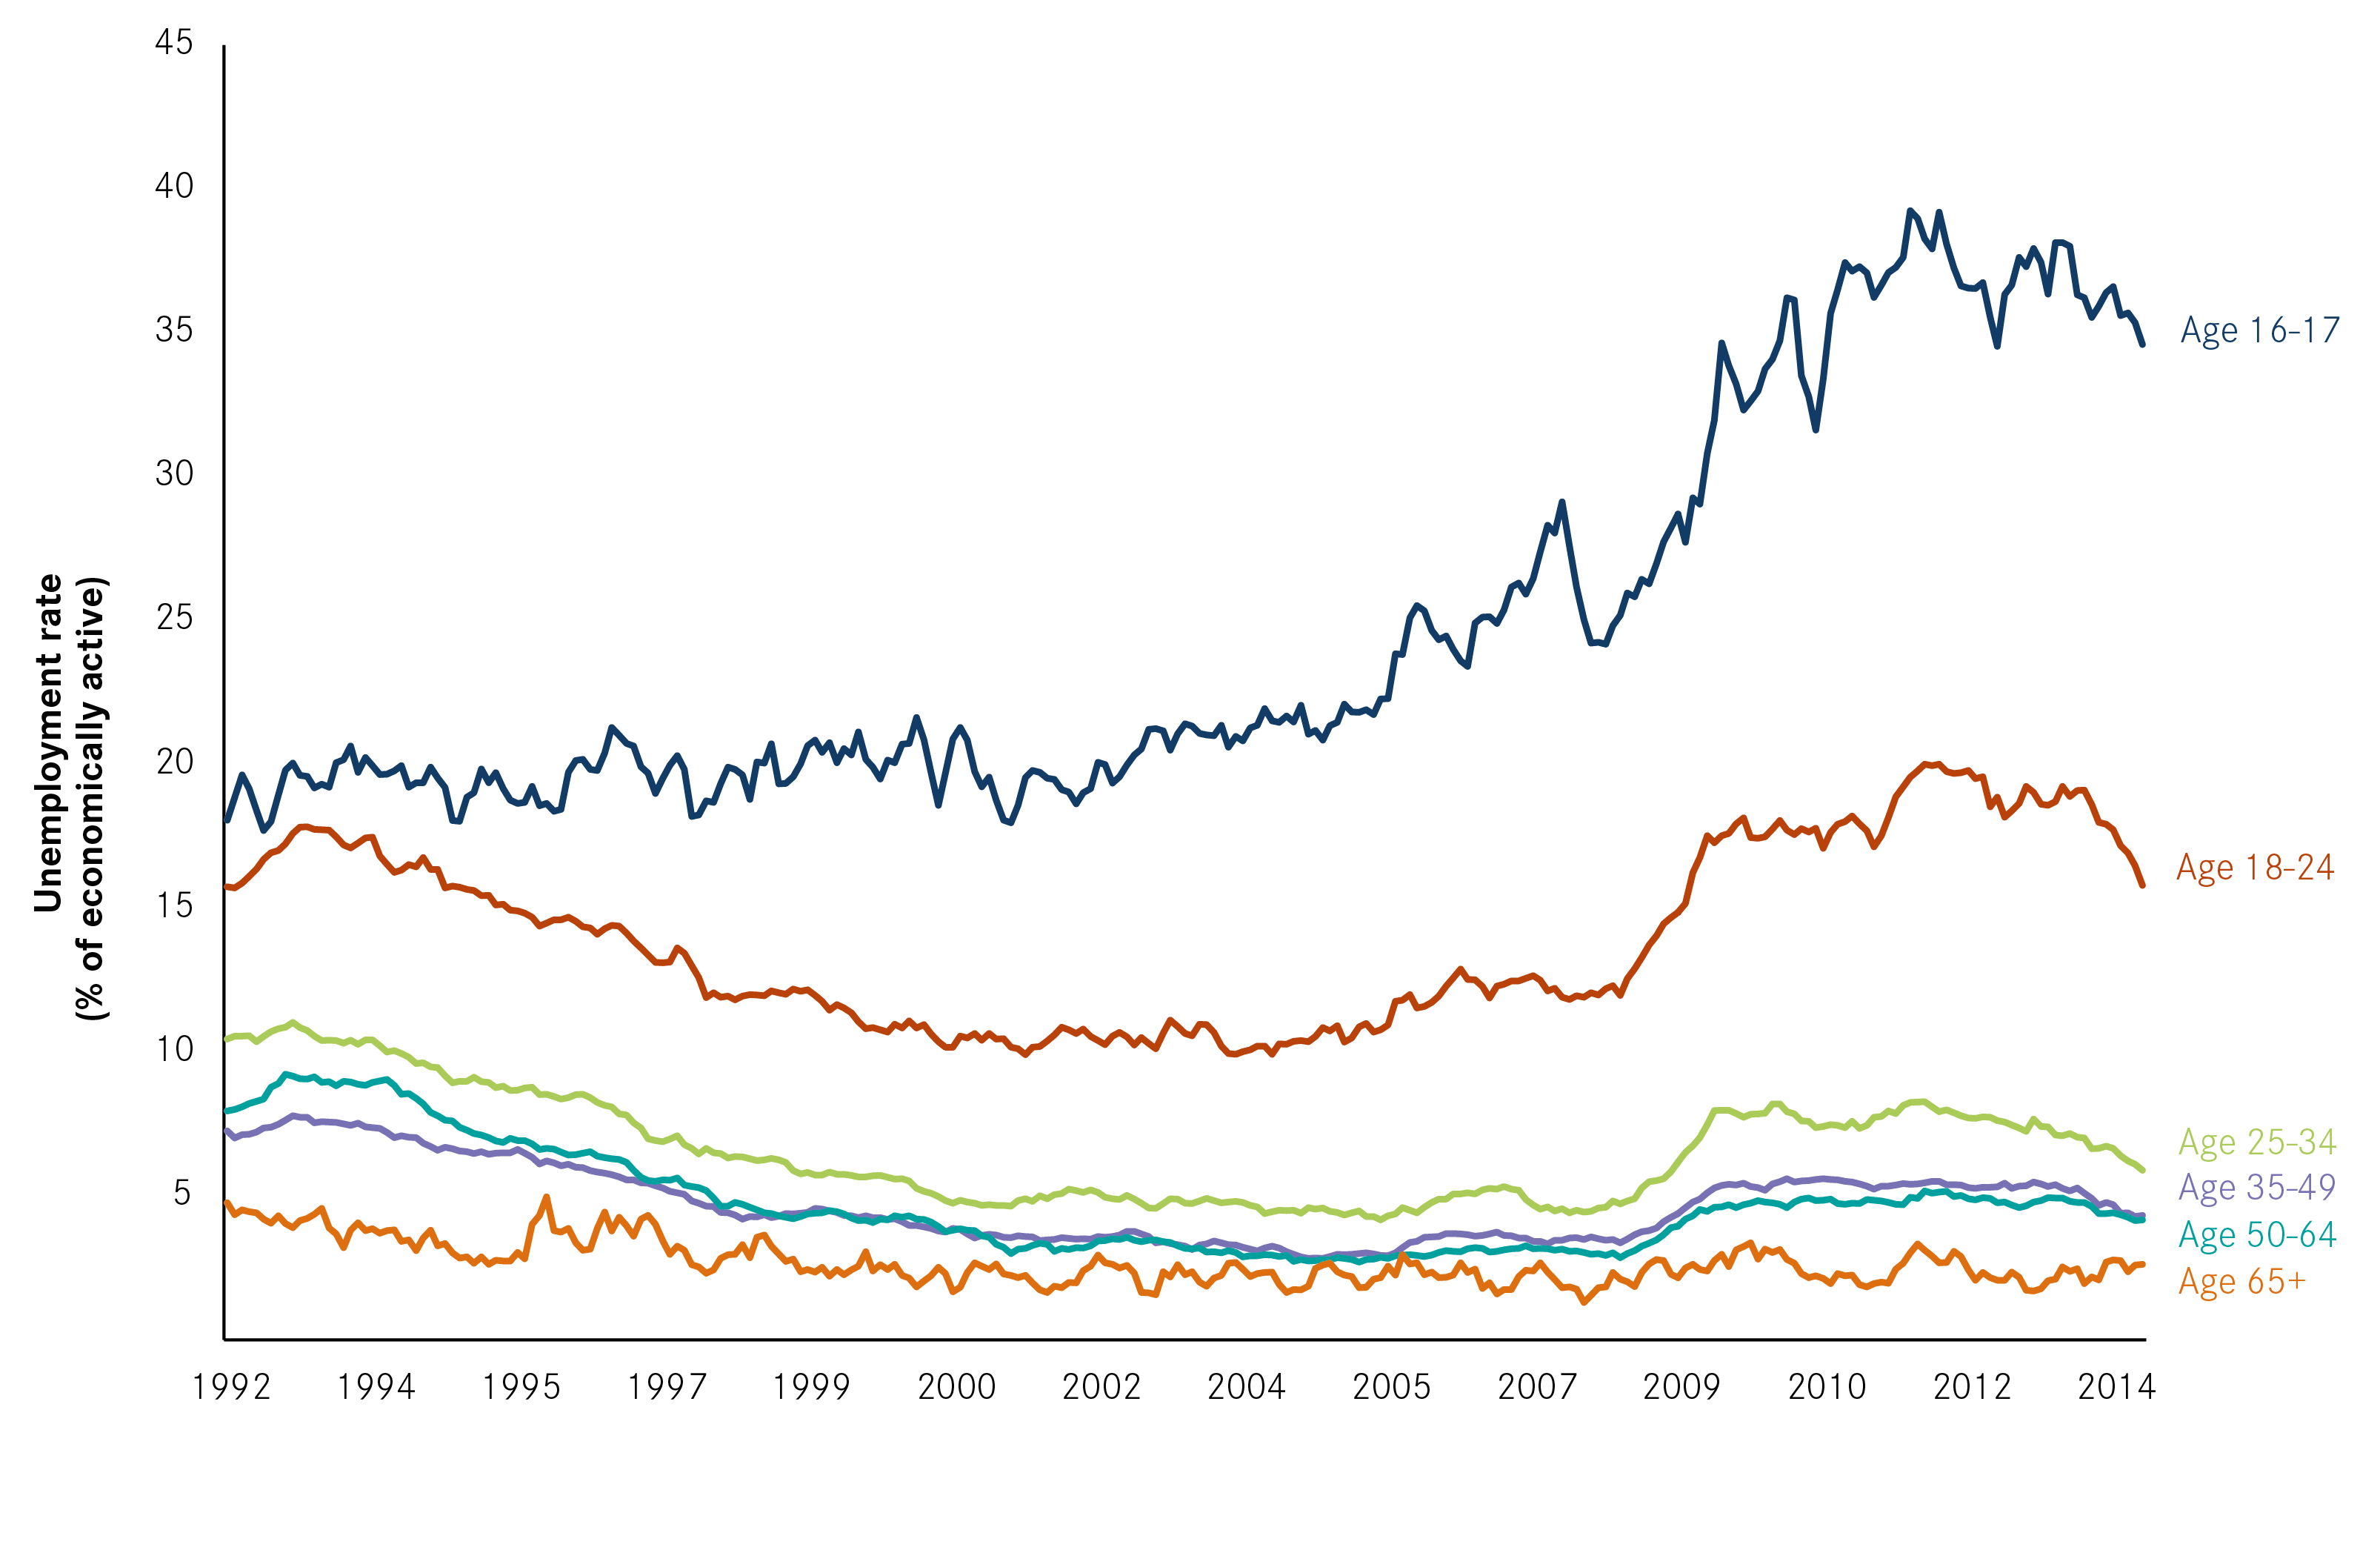
Youth unemployment has been rising since the early 2000s, indicating the root cause of today’s levels of youth unemployment goes beyond the recession. Between Q1 2004 and Q1 2007, youth unemployment as a share of the 18 to 24 year old population increased from 7.7 to 9.3. Youth employment outcomes started to worsen in the 1970s with the entry of the baby boomers into the labour market. Youth unemployment increased further still relative to older workers during the 1980s and 1990s, and was accompanied by an increase in the wage gap.5 The issue came back to the fore during the recession as youth unemployment increased more rapidly than the overall level of unemployment, hitting record levels in 2011. A growing gap between young people and older workers emerged over the course of the recession. At its height in Nov-Jan 2011, the unemployment rate for 16 to 24 year olds stood at 22.3 per cent, over 16 percentage points above the unemployment rate for 25 to 64 year olds at 6 per cent (Figure 1). Youth unemployment reached a record high of over 1 million towards the end of 2011 and remains 30 per cent higher than pre-recession (Dec to Feb 2014). The number of 16 to 24 year olds Not in Employment, Education and Training (NEET) peaked at 1.27 million in 2011 and was 975,000 in the first quarter of 2014.6
Figure 1: Youth unemployment rate (% of economically active population aged 16-24 years old), 1992 to 2013
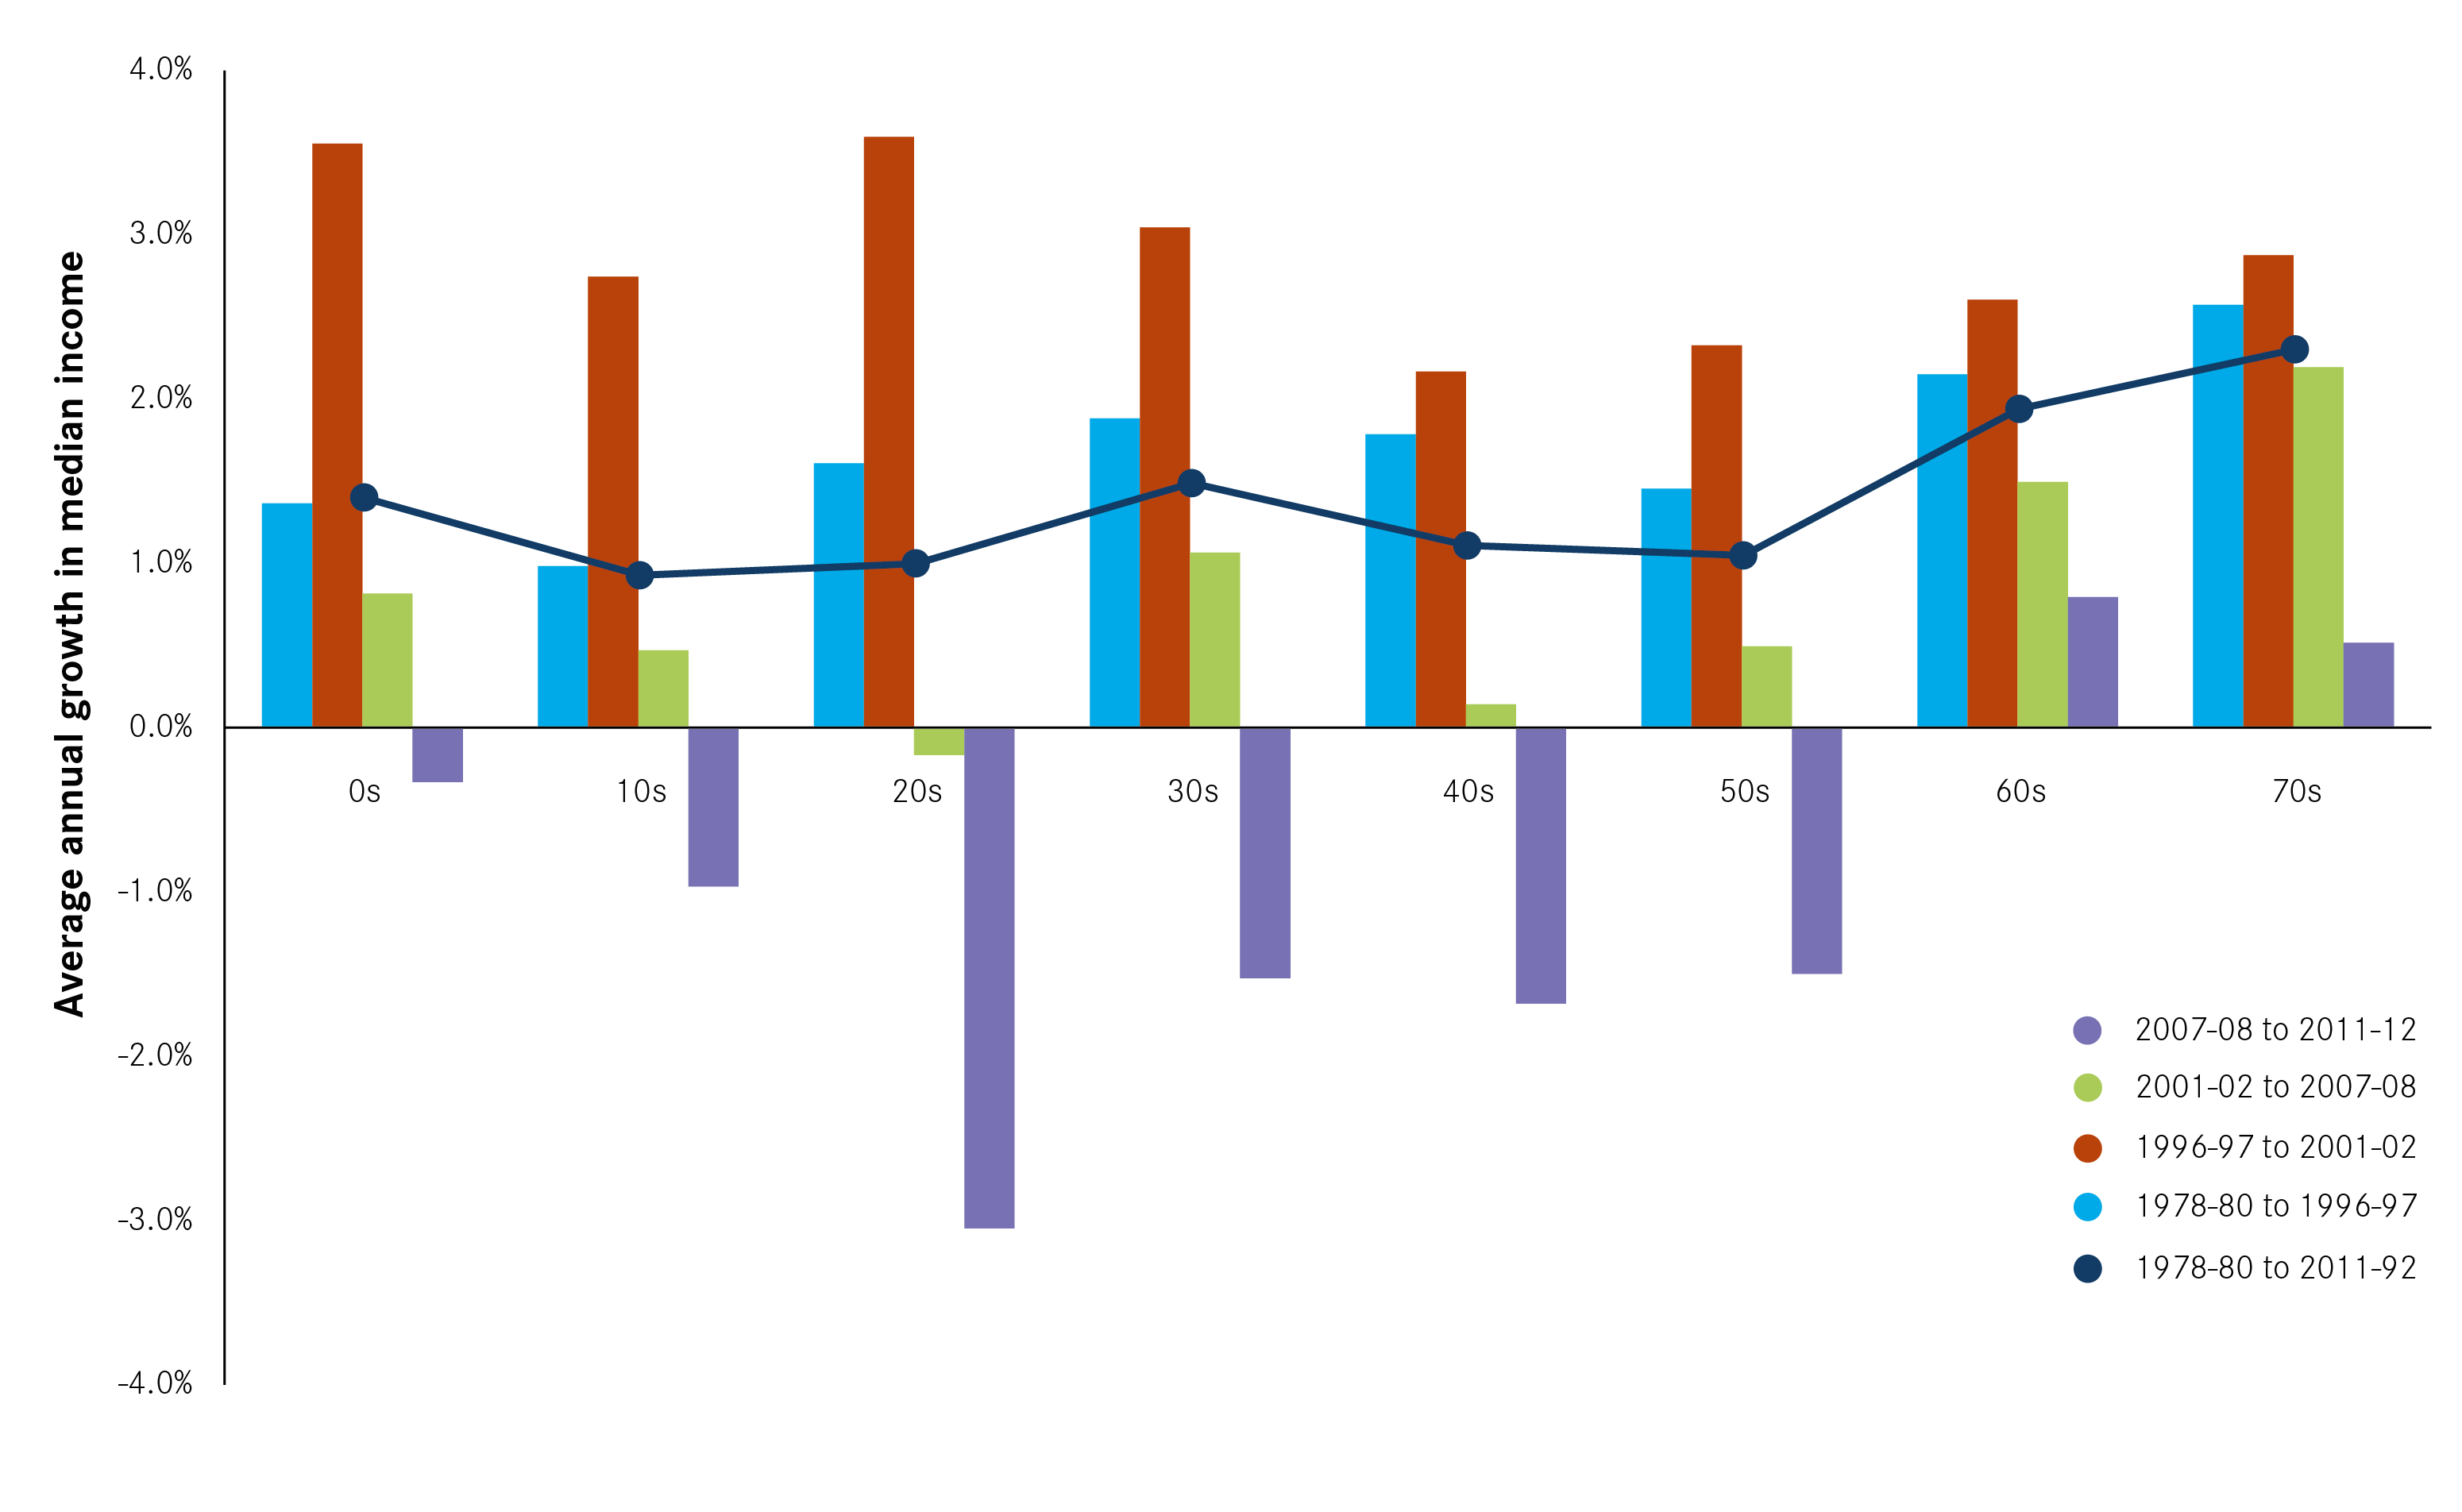
‘Bumping down’ in the labour market as a result of the economic downturn means that young people are also more likely to be underemployed if they are in work. For those trying to find their first job during recessions, it is not just being out of work that can have a negative impact – young people are also scarred from a fall in the quality of jobs typically available to them during these times. As the competition for jobs increases, young people tend to get squeezed out of the labour market by older workers with more experience. In turn, graduates squeeze out lower qualified young people: in 2013 47 per cent of graduates were working in a job that does not require a degree, up from 37 per cent in 2001.7 More than a third of ‘non-recent’ graduates were working in jobs that did not require a degree in 2013, up from 29 per cent in 2001. An IFS study shows that the incomes of young adults have started to fall behind the rest of the population.8 Between 2007/08 and 2011/12 (Figure 2), median income among the group fell by an annual average of about 3 per cent per year – more than for any other group (Figure 2). This is not surprising given their falling employment rates during and since the recession, at a time when employment among older age groups has been remarkably robust.
Figure 2: Average annual growth in median income by age since 1978-1980
This report aims to build understanding amongst local and national policy makers on the most effective ways to improve employment outcomes for young people in the UK. Young people can face multiple barriers to finding and staying in work. These range from a fall in jobs available due to the recession to long running issues such as skills mismatch, intergenerational unemployment and low awareness of the support available to move young people into or keep them in education and employment (Box 1). Many of these barriers vary by city: in some city there are more jobs available; in others there are far fewer, or there may be more opportunities for those with certain types of skills. A number of cities have developed their own initiatives to reduce youth unemployment and lessons can be learnt both from these and from evaluations of national policies.
Box 1: Barriers to youth employment
Overall lack of demand in the economy: the recession has forced businesses to close or to lay off workers and unemployment has risen as a result.
Mismatch between the skills young people have and skills demanded by employers: The National Employer Skills survey finds long-running concerns from employers that the educational system prioritises academic qualifications over skills – 55 per cent say school leavers lack the right work experience and key attributes that set them up for success, including self-management (54 per cent); problem solving (41 per cent); and attitude to work (35 per cent) stressing the need for school reform to produce people who have basic employability skills as well as academic knowledge.9
Lack of experience and skills compared to older workers: Younger workers tend to have fewer general work skills relative to older workers and less specific human capital relevant to the particular firm employing them.10 68 per cent of young people feel they are unemployed due to lack of experience.11
Low levels of aspiration: Inter-generational unemployment and the geographical concentration of unemployment may be associated with low expectations and a lack of role models – parents may not have the knowledge to advise their children on how to find employment.
Social/behavioural constraints: Gang culture, substance misuse and a criminal record all reduce the likelihood a young person will be able to find and remain in employment.
Uncertainty that it pays to be in work: The wage offered may not provide adequate compensation for the loss of benefits and additional transport costs of getting to work. This may be compounded by short or fragmented hours of work.
Lack of mobility and limited job search horizons: Some young people have a very narrow geographic search area for jobs which severely limits their job opportunities.12 Young people are also likely to have fewer contacts and less experience of finding work.10
Low awareness of the support available to young people: The complexity of the system can lead to young people being confused about what help is available to them and where to go to get it and to employers being uncertain or unaware about what financial incentives exist to take on a young worker. The UK Commission’s report on Employer Perspectives Survey recorded only 15 per cent of employers citing awareness of the Young Person Guarantee and just over 53 per cent citing an awareness of apprenticeships.14
The interplay between these barriers varies across cities, as does the scale of youth unemployment and disengagement, yet there has long been a lack of local flexibility in labour market policy. The youth claimant rate in the UK stands at 3.7 per cent (as of July 2014), but there is huge variation in the scale of youth unemployment across the country (Figure 3). Less than 1 in 100 young people in Cambridge and York claim Job Seekers Allowance (JSA) compared to nearly 1 in 15 in Grimsby and Hull. Claimant rates also vary widely between neighbouring cities. In the Leeds City Region, Barnsley has the highest youth claimant rate of 4.4 per cent, while the lowest rate of 0.9 per cent is recorded in York. With 63 per cent of young UK claimants based within the UK’s 64 largest cities, establishing strategies for cities to lower their youth claimant rates is essential.
Figure 3: Youth claimant rate in different cities

The next section looks at policies targeted towards reducing youth unemployment in the UK, and the degree of flexibility local partners have in addressing the particular challenges their area faces.