
03City performance across Europe
How do UK cities compare to their other European counterparts? This section explores the relative performance of UK cities on five economic indicators: industrial structure, skills, innovation, employment and productivity.
Industrial structure
The industrial structure of cities, which reflects the type of investment they have attracted over time, varies across Europe.
Figure 8: Cities by share of manufacturing and utilities jobs, 2011
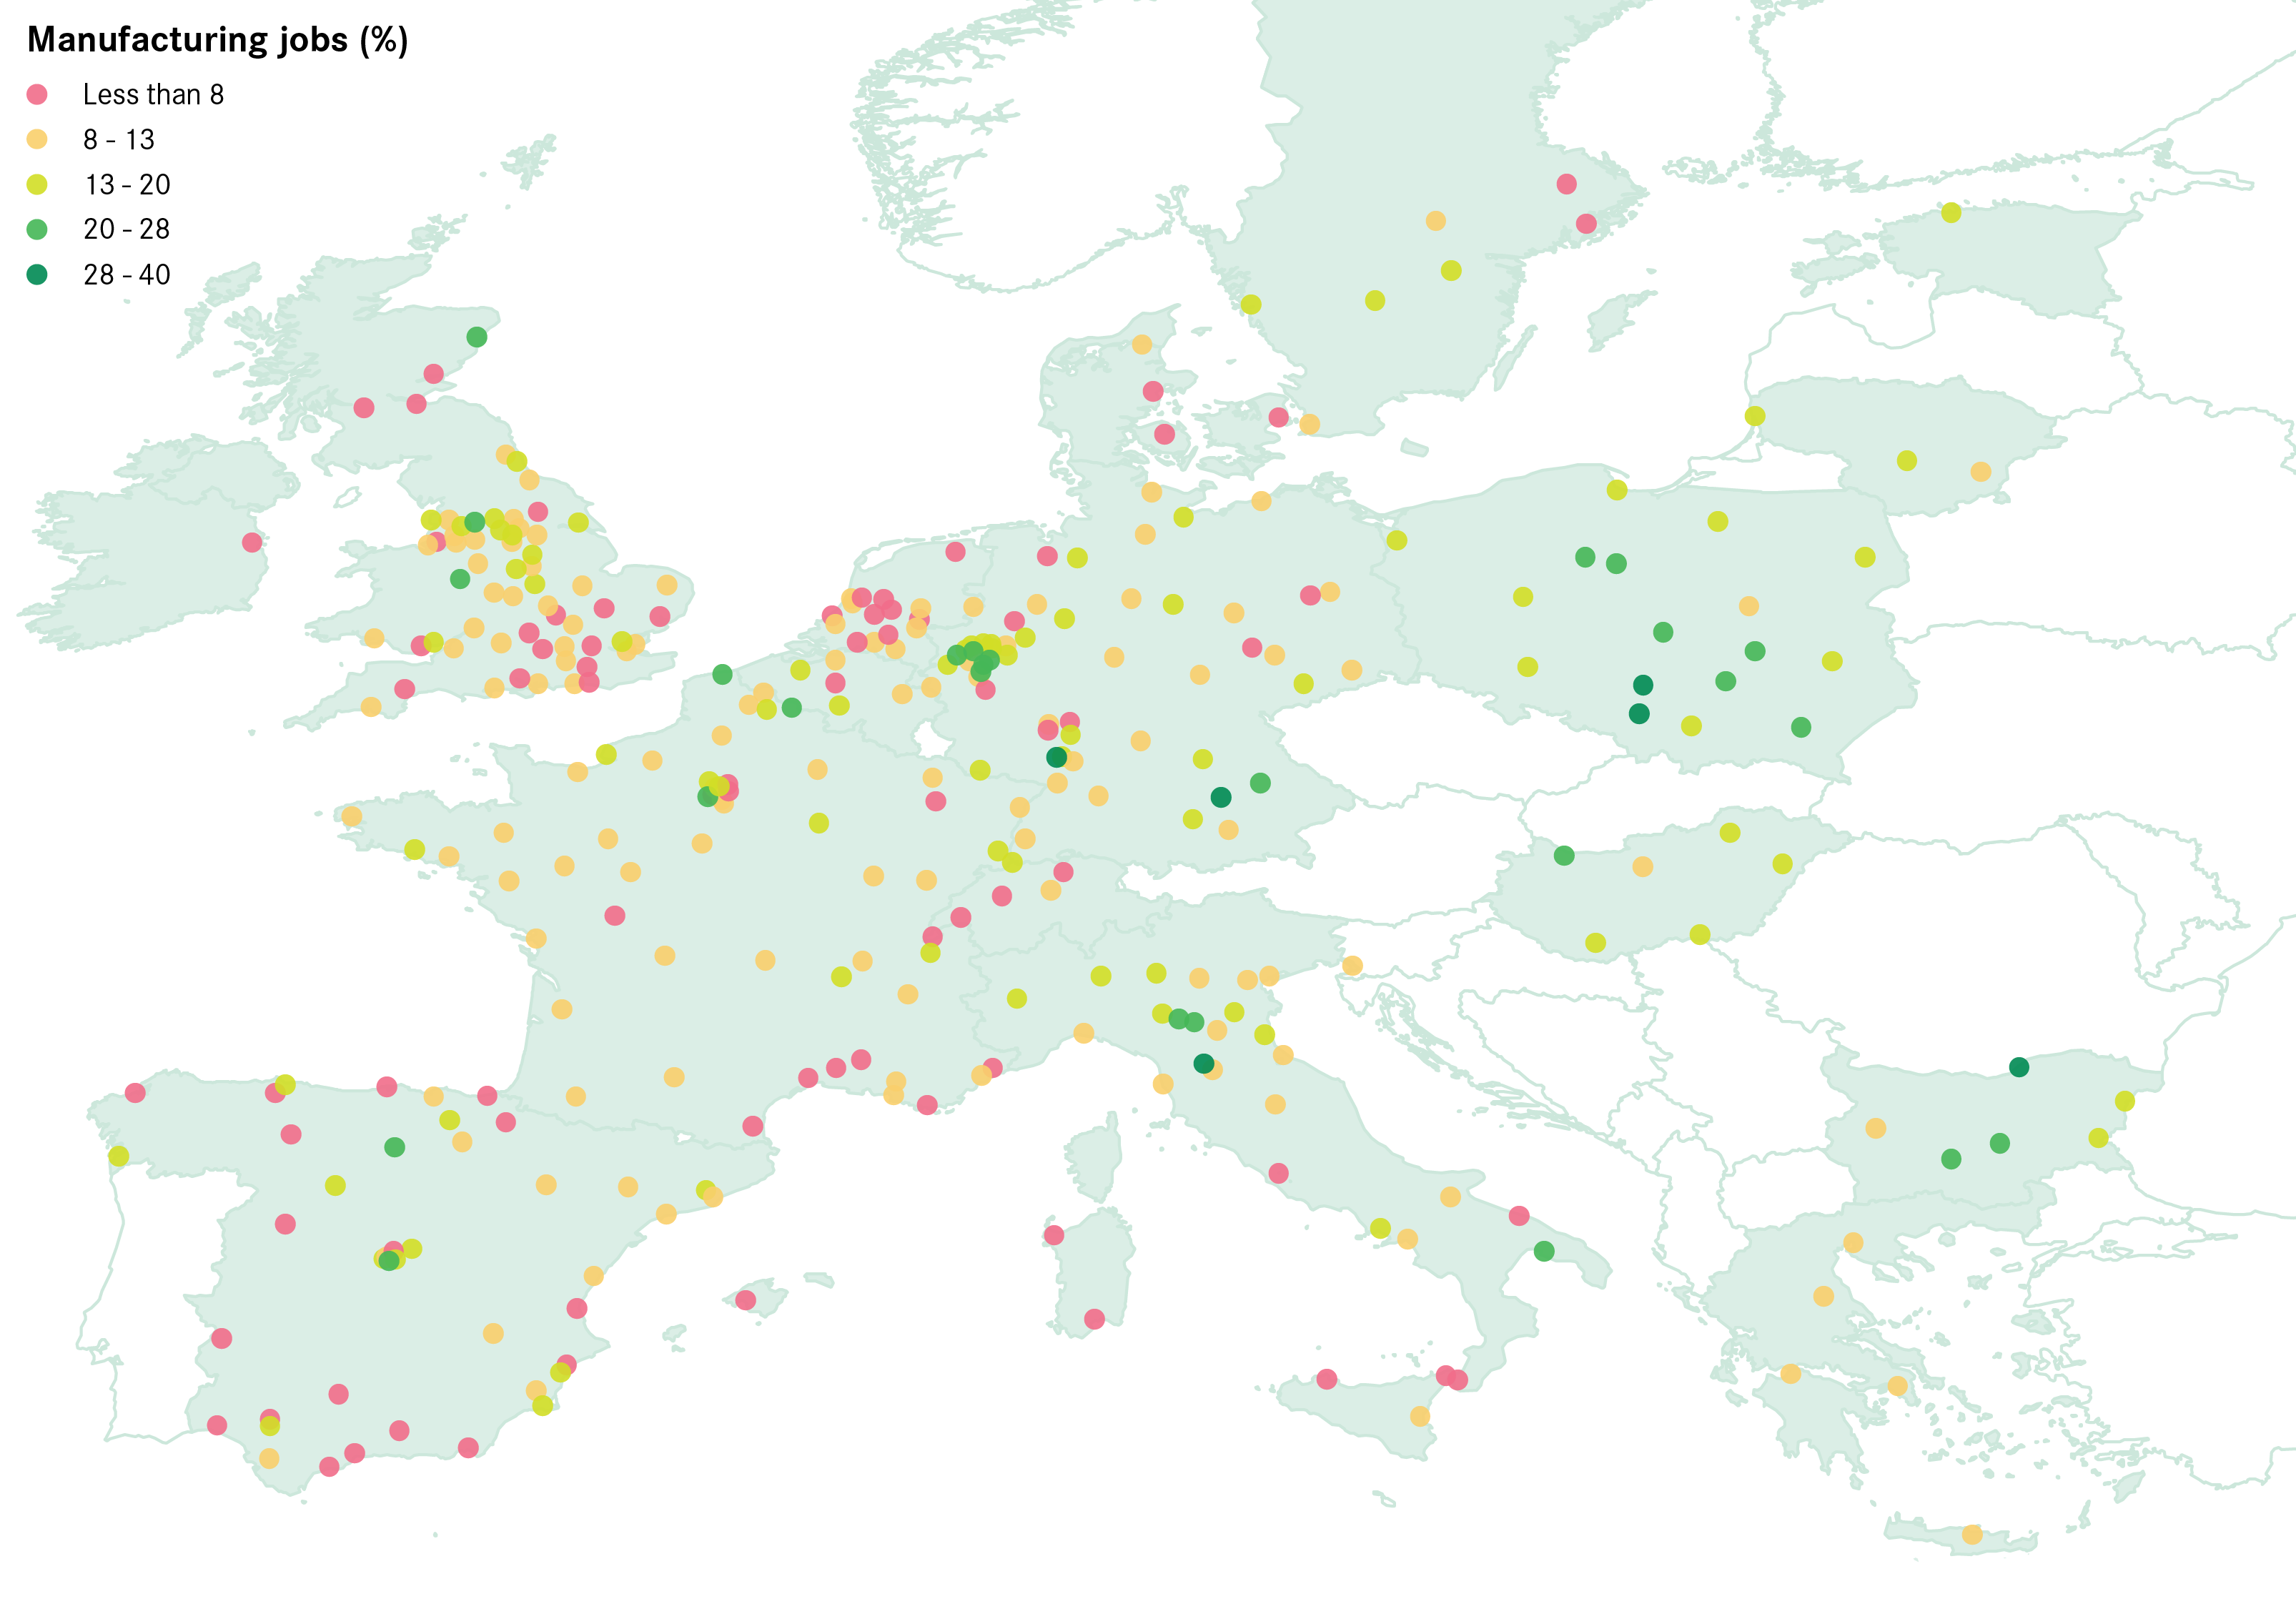
Cities that are more reliant on manufacturing and utilities (Figure 8) are mostly located in the North of England, in Germany, in the North of Italy and in Eastern Europe.5 In total, 11 UK cities are in the top 25 per cent of European cities for their proportion of manufacturing and utilities jobs, with cities such as Burnley, Bradford and Telford having around 20 per cent of their workforce employed in these industries. Ingolstadt in Germany is the European city with the highest share of jobs in manufacturing and utilities (39 per cent), followed by Ludwisghafen am Rhein (38 per cent). Ruse in Bulgaria, Czestochowa in Poland and Prato in Italy are among the top 10 cities with the highest share of manufacturing and utilities jobs, all above 30 per cent of the total workforce.
Figure 9: Cities by share of business services jobs, 2011
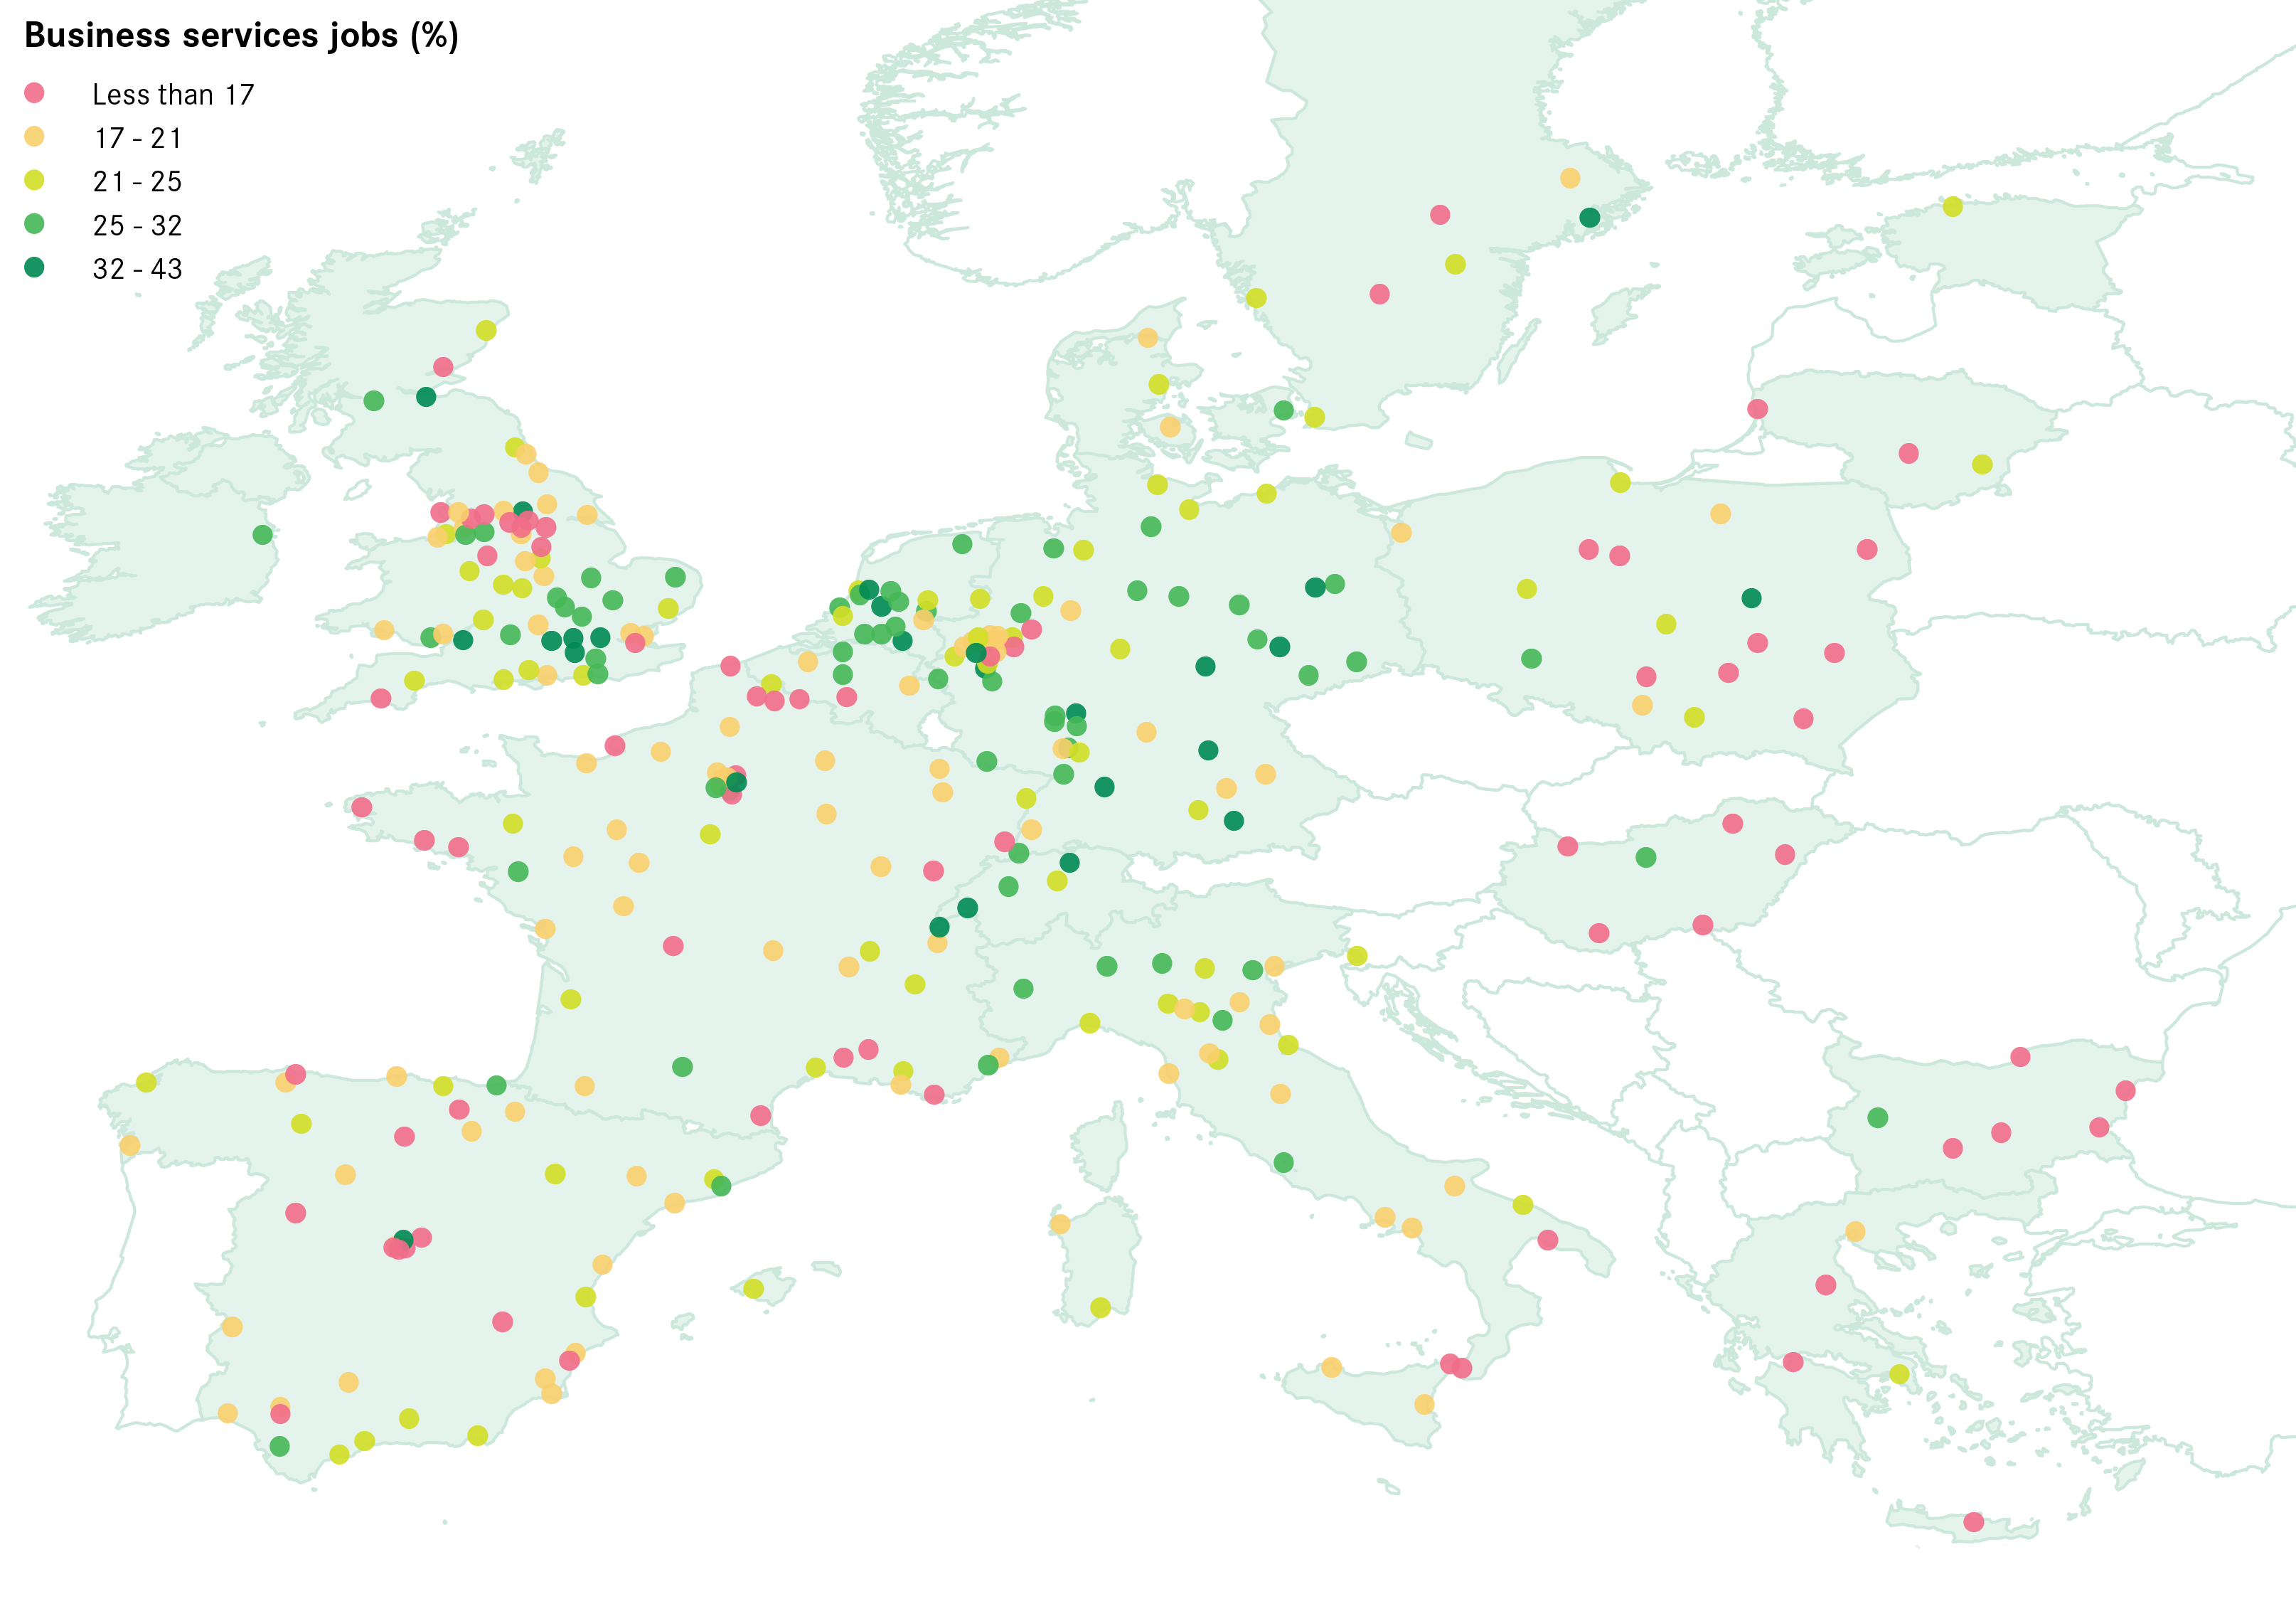
Figure 9 shows a concentration of highly service-oriented cities in specific areas, in particular in the South East of England, as well as in Belgium, the Netherlands, Germany and Switzerland. In total, 19 UK cities rank in the top 25 per cent of European cities for their share of business services – with London and Reading ranked 3rd and 4th respectively. Although the most service-oriented cities are located in the Greater South East, Leeds, Edinburgh and Warrington also have more than 30 per cent of their workforce employed in business services.
Across Europe, Frankfurt and Zurich are the two cities with the highest share of business services (43 and 41 per cent respectively). Cities with the highest shares of business services tend to be relatively large, with Amsterdam, Munich, Dusseldorf and Madrid all appearing in the top 10, all with more than 35 per cent of jobs in these sectors.
There is a significant split seen across UK cities. While 19 cities rank in the top 25 per cent for their share of jobs in business services, 15 rank in the bottom 25 per cent. This occurs to a lesser extent in Italy, where five cities – all located in the north of the country with the exception of Rome – rank in the top 25 per cent for their concentration of business services, while five other cities – four of them located in the south – rank in the bottom 25 per cent.
Germany does not show such divides: there are 26 cities in the top 25 per cent for business services jobs, and only three in the bottom 25 per cent. But interestingly, the Rhine-Ruhr area concentrates both manufacturing and services cities: larger cities (Dusseldorf, Cologne, Essen) have more than 30% of business services jobs, while surrounding cities have relatively high shares of manufacturing and utilities jobs (Leverkusen, Krefeld, Solingen).
Skills
Human capital is an essential element to urban economic performance. Research has shown that individual graduates tend to receive higher wages,6 that the proximity to college-educated workers enhances lower-educated workers’ wages, 7 and that a higher stock of human capital is positively correlated with urban productivity.8
High-skilled population
As shown in Figure 10, the UK has a high proportion of high-skilled residents.9 A third of the population aged 25-64 (or 11 million inhabitants) have at least a university degree or equivalent, which means the UK has the third largest share of high-skilled residents in Europe, after Estonia and Lithuania. Several countries have about the same share of high-skilled residents nationally, including Sweden, Denmark, Spain, Switzerland and France.
Figure 10: Share of high-skilled residents (cities and countries), 2011
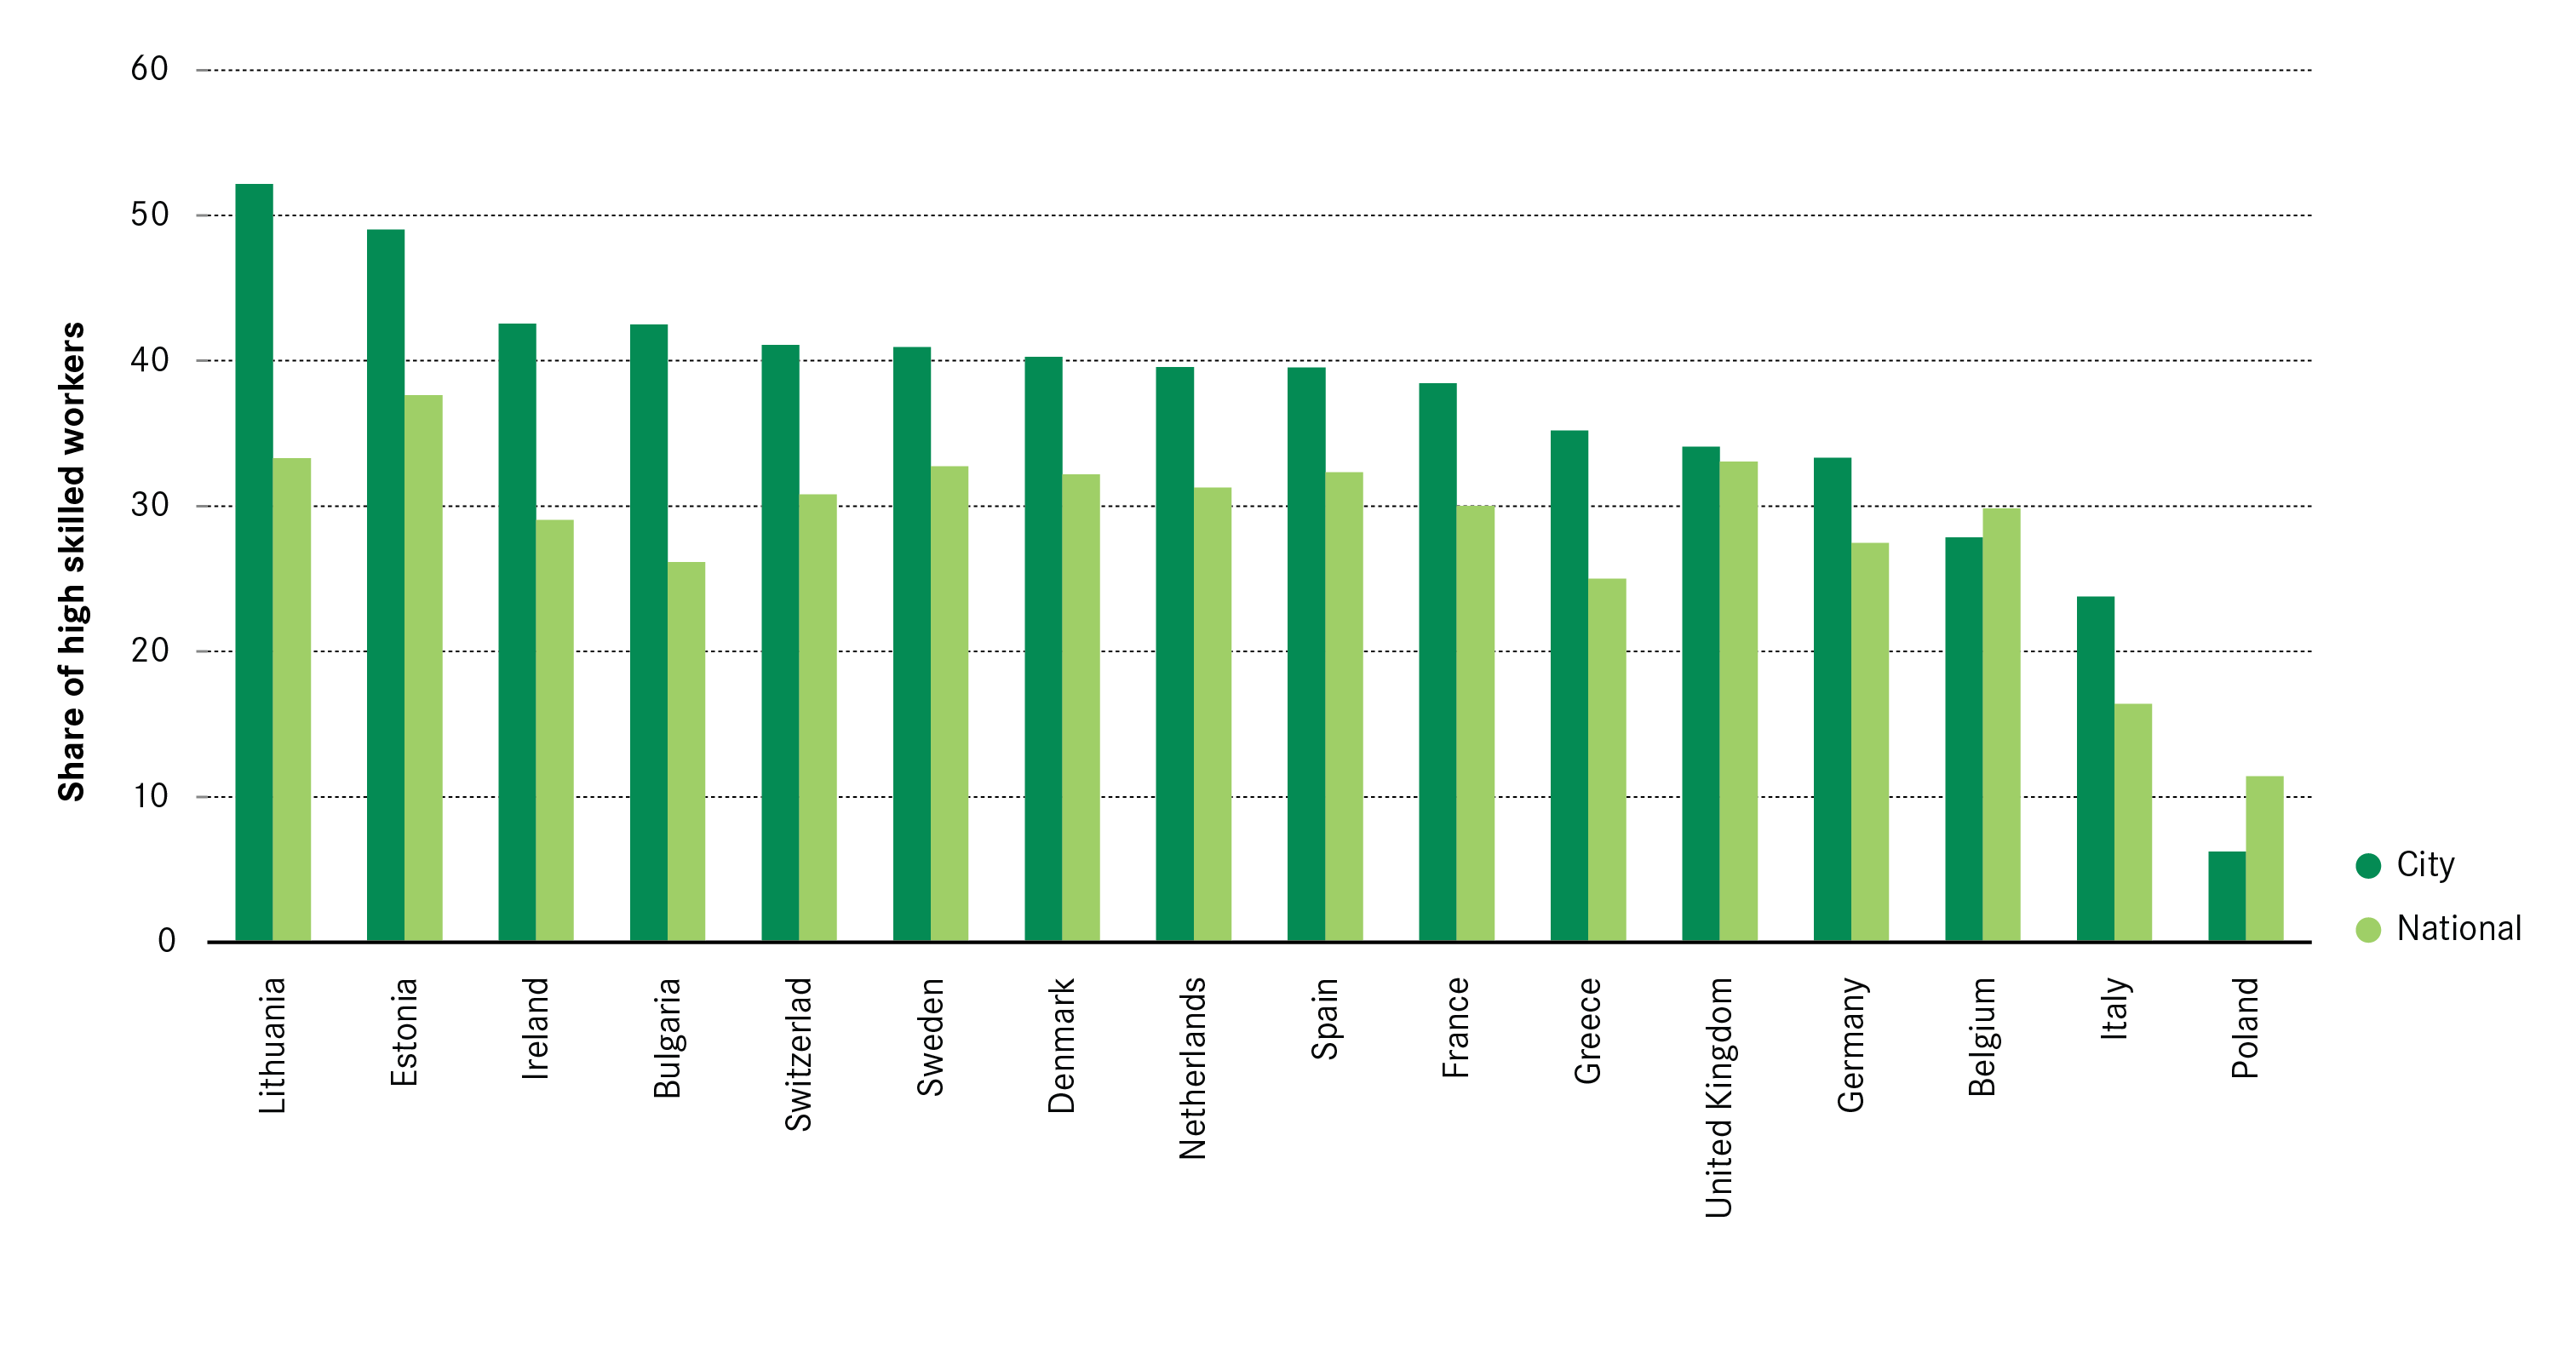
As in most countries, cities in the UK have a higher share of high-skilled residents than the national average. But the differential between cities and the entire country is only about 1 percentage point, meaning that high-skilled residents do not significantly concentrate more in cities.
As a result, UK cities have a lower share of high-skilled residents than cities in most other countries. On average 34 per cent of residents in UK cities are high-skilled. In French cities, around 39 per cent of residents are high-skilled, while this reaches 40 per cent in Spain, Denmark and the Netherlands. In Germany however, the number of high-skilled residents in cities is about the same as in the UK (see Box 2).
Going beyond these average figures shows that there are great disparities in the distribution of high-skilled residents across UK cities. On the one hand, Cambridge, Oxford and Edinburgh all rank in the top 10 cities across Europe for high-skilled residents, with Cambridge ranking first across the continent.
On the other hand, more than half of all UK cities (35/62) have a proportion of high-skilled residents between 20 and 30 per cent, which is significantly lower than the European city average (34 per cent). And 17 cities, including Hull and Mansfield, appear in the bottom 25 per cent of European cities for their share of high-skilled residents.
Low-skilled population
The underperformance of UK cities is even starker when looking at low skills. The UK stands out in Europe regarding the share of low-skilled residents in the population, both at the national and city level. As Figure 11 shows, UK cities have a significantly higher share of low-skilled residents compared to cities in most other European countries, with 34 per cent of the urban population having not achieved five good GCSEs. In the Netherlands the proportion of city residents with equivalent education levels is 25 per cent, and only 16 per cent in German cities and 12 per cent in Swedish cities. Interestingly, several Eastern European countries including Bulgaria, Hungary and Lithuania have very low proportions of low-skilled residents in their cities – in Lithuania for instance they represent only 3 per cent of the city population.
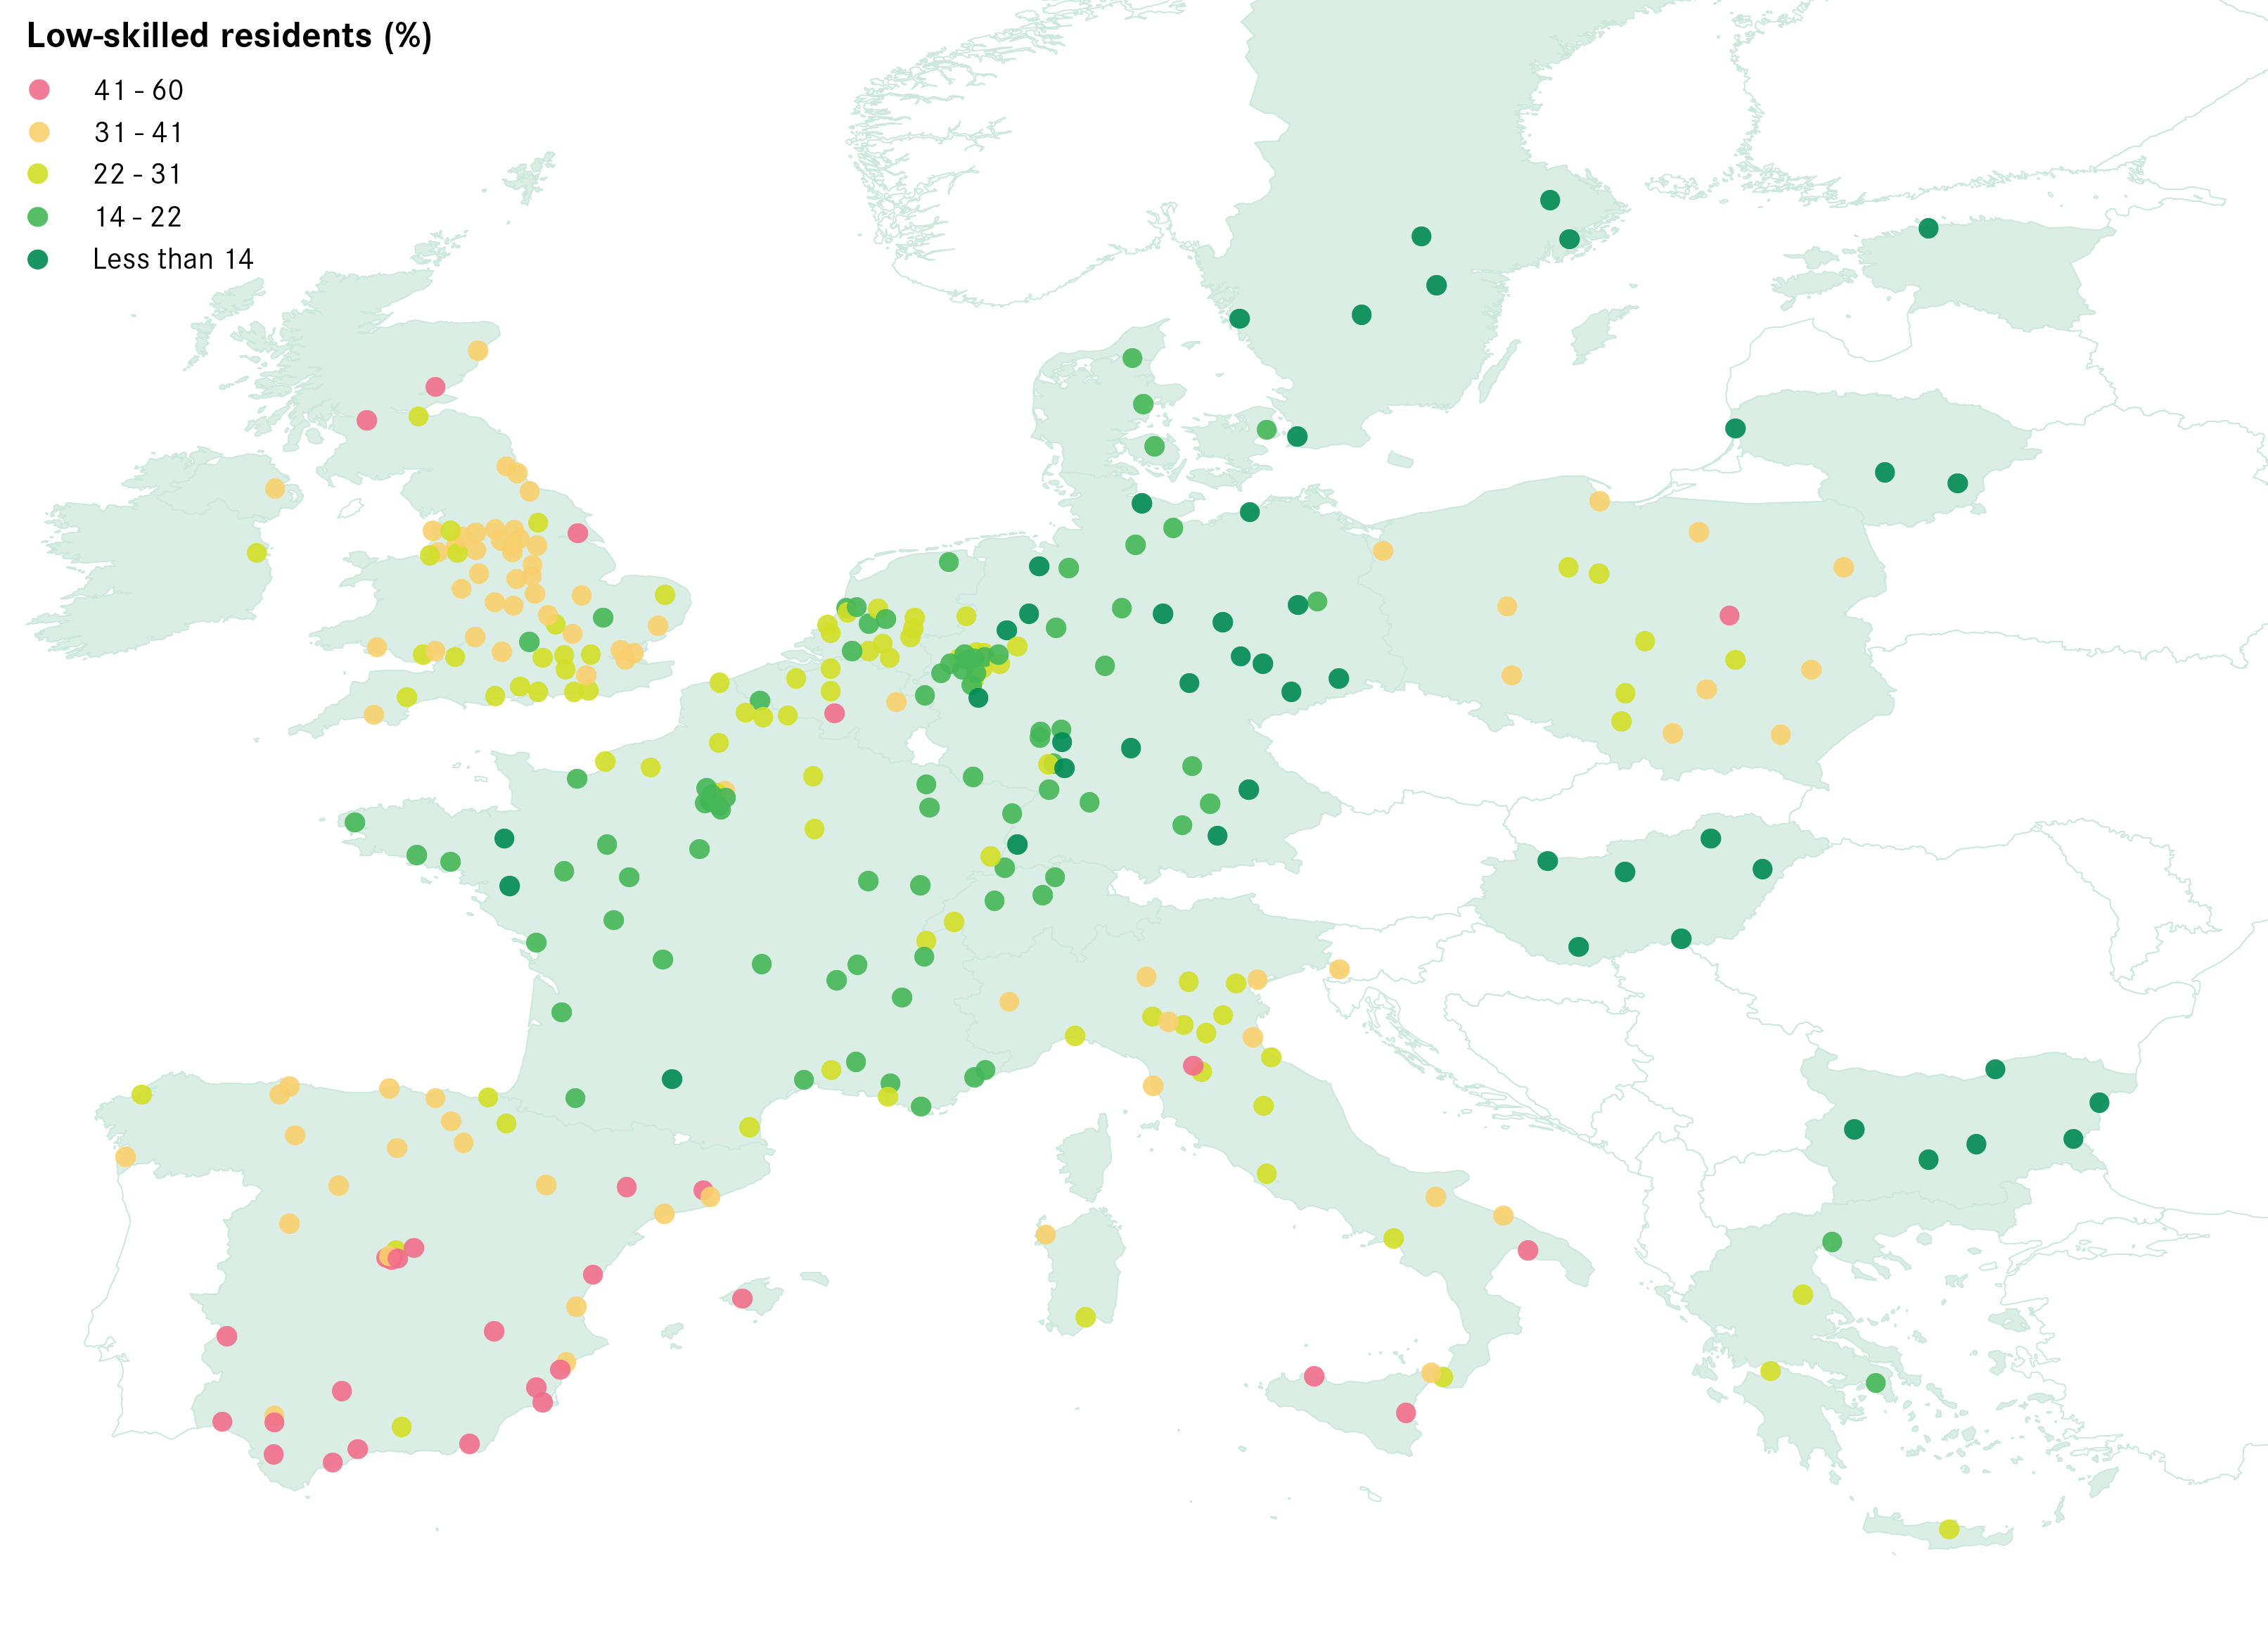
Figure 11: share of low-skilled residents, 2011

Figure 12 highlights the significant number of cities that have a high share of low-skilled residents in the UK. Just six cities have a lower share of low-skilled residents than the European city average (25 per cent): Brighton, London, York, Reading, Oxford and Cambridge. At the other end of the spectrum, 25 out of 63 UK cities are in the top 25 per cent for their share of low-skilled residents, including Dundee, Glasgow, Hull, Mansfield and Wakefield. Across Europe, cities with a high proportion of low-skilled residents are mostly located in Spain, Belgium, Italy and Poland. But the proportion is significantly lower in French, German or Swedish cities – low skills are much less of a problem there.
Figure 12: Low-skilled population, 2011
Box 2: Medium skilled workers in Germany
German cities have some of the lowest shares of low-skilled residents of all European cities. Only four cities in Germany have a higher proportion of low-skilled residents than the European average. That said, the proportion of high-skilled residents is also relatively low, with half of the cities below the European average.
There appears to be two reasons for this. The first is that the German education system requires students to study until they are 18. This has only been recently applied in the UK. The second is that the system strongly encourages students to pursue vocational training and apprenticeship programmes, as opposed to the traditional curriculum leading to university.
German students can choose to study in duale berufsausbildung (dual vocational training) around age 16, where they get both classroom instruction and on-site training in a company. After completing the programme, apprentices have the option to undertake through further part-time vocational training or higher education, and on average 59 per cent of them are employed by the training firm. A firm is estimated to save some £3,750 in recruitment and training cost for each apprentice they hire full-time.10
Vocational training is a very common education pathway in Germany. In 2012, 54 per cent of the German workforce had received its qualification through a dual education apprenticeship, while university graduates only represented 18 per cent of the workforce.11
Innovation
Innovation is the main driver of long-term economic growth. Although the impact of innovation on growth is difficult to measure, research estimates that innovation contributes to about a third of economic growth.12
Figure 13 shows the number of patents filed to the European Patent Organisation (EPO) in 2011, normalised by population. There is a clear belt of innovative cities stretching from Belgium and the Netherlands to Switzerland and the French Alps, crossing most of the west of Germany – 12 of the 20 cities with the highest number of patents per inhabitant are German (see Box 3). Some cities in the North of Italy, along with Scandinavian cities, also have a high number of patents per 100,000 inhabitants.
Figure 13: Patents per 100,000 inhabitants, 2011
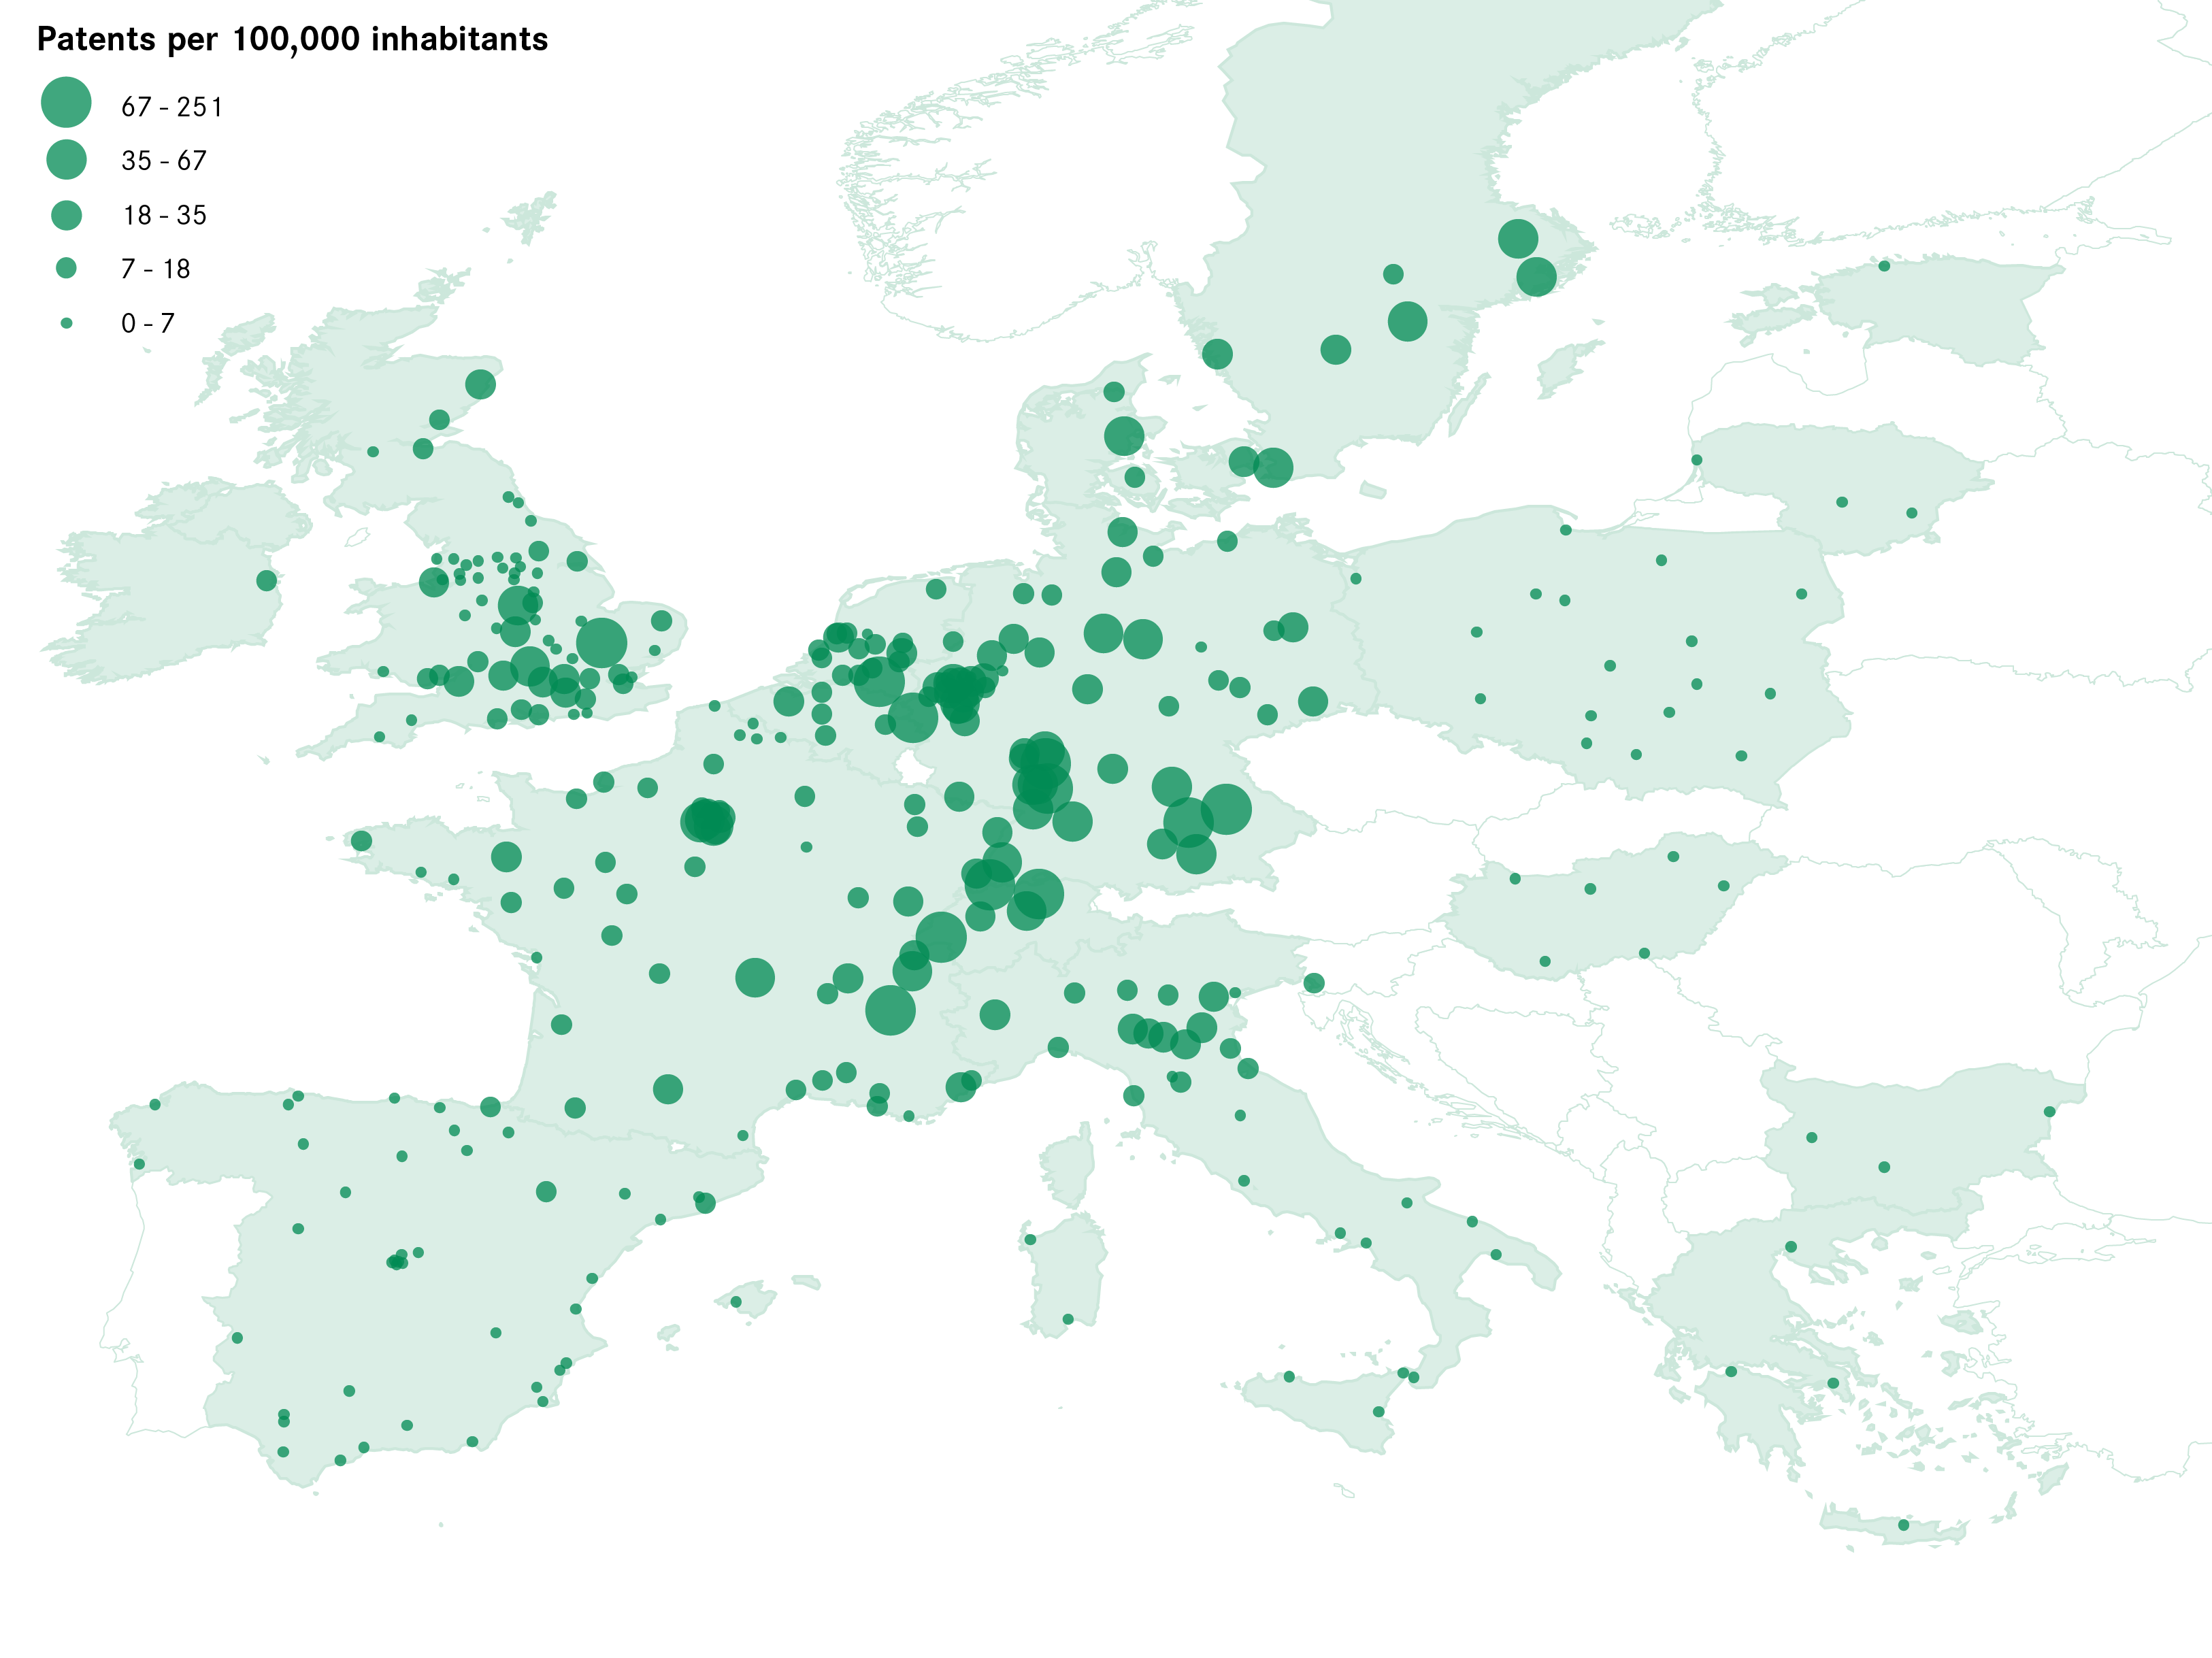
In the UK, there is a clustering of innovative cities in the Greater South East, with the notable exceptions of Coventry, Derby, Birkenhead and Aberdeen. In total, 11 UK cities are in the European top 25 per cent for the number of patents per inhabitants. Two cities, Cambridge and Oxford, rank in the top 20 cities on this measure, with 74 and 50 patents per 100,000 inhabitants respectively.
However, UK innovation is mostly concentrated in these few cities. Figure 14 shows that on aggregate, UK cities performed relatively poorly in terms of patents per inhabitants compared to other European countries, with about 8 patents per 100,000 inhabitants. This compares with 19 patents per 100,000 inhabitants in French cities, 30 per 100,000 inhabitants in German cities and 58 per 100,000 inhabitants in Swiss cities.
Figure 14: Patents per 100,000 inhabitants, 2011

Cities that produce the most patents in the UK are mostly small or medium-sized. Out of the 11 cities in the top 25 per cent, seven are small and three are medium-sized, while only one – Bristol – had a population of more than 500,000.
The lower amount of patent registrations in large cities seen in the UK does not hold across Europe. Figure 15 shows the number of patents per 100,000 inhabitants in the largest European cities (cities with more than 1 million inhabitants). London (8), Manchester (5) and Birmingham (3) perform poorly relative to other large cities. Paris has 26 patents per 100,000 inhabitants, Berlin has 20, and Amsterdam 13.
Figure 15: Patents per 100,000 inhabitants of largest cities (more than a million inhabitants), 2011
Box 3: Innovative cities profile
The top 20 cities with the highest number of patents per 100,000 inhabitants have some interesting similarities.
15 of the top 20 cities have at least one university ranked in the top 500 QS World University Ranking. Among these, six cities have a university ranked in the world top 100: Cambridge, Oxford, Zurich, Lausanne, Munich and Heidelberg. But university R&D does not tell the whole story. Many of these cities also have high numbers of innovative and tech industries, which benefit from the proximity to public research institutions for collaboration and retention of talented workers. Eindhoven in the Netherlands, Cambridge in the UK or Grenoble in France are examples of such “regional innovative systems”.13
That said, a number of cities do not have a highly-ranked university but are nonetheless strongly innovative: Ingolstadt, Ludwigshafen am Rhein, St-Quentin-en-Yvelines, Mulheim an der Ruhr and Leverkusen. All these cities have more than 20 per cent of their workforce employed in manufacturing and utilities and all belong to the top 10 per cent of cities with the highest proportion of jobs in these industries. These cities are typically small in size and their economy is dominated by one or two large manufacturers, which explains the very high number of patents per inhabitants. In Germany, Ingolstadt is home to the headquarters of the car manufacturer Audi, Ludwigshafen am Rhein is the site of BASF – one of the largest chemical producers in the world, and Leverkusen benefits from the presence of the pharmaceutical group Bayer. St-Quentin-en-Yvelines, in France, is home to car manufacturer Renault’s R&D centre.
Finally, it seems that city size is not a major criterion for innovation. 16 of the top 20 cities are small or medium-sized (125,000 to 500,000 inhabitants), but three cities have more than 500,000 inhabitants and one city (Munich) has more than 1 million inhabitants.
Employment
The UK has a high employment rate nationally, and this good performance is reflected across its cities.
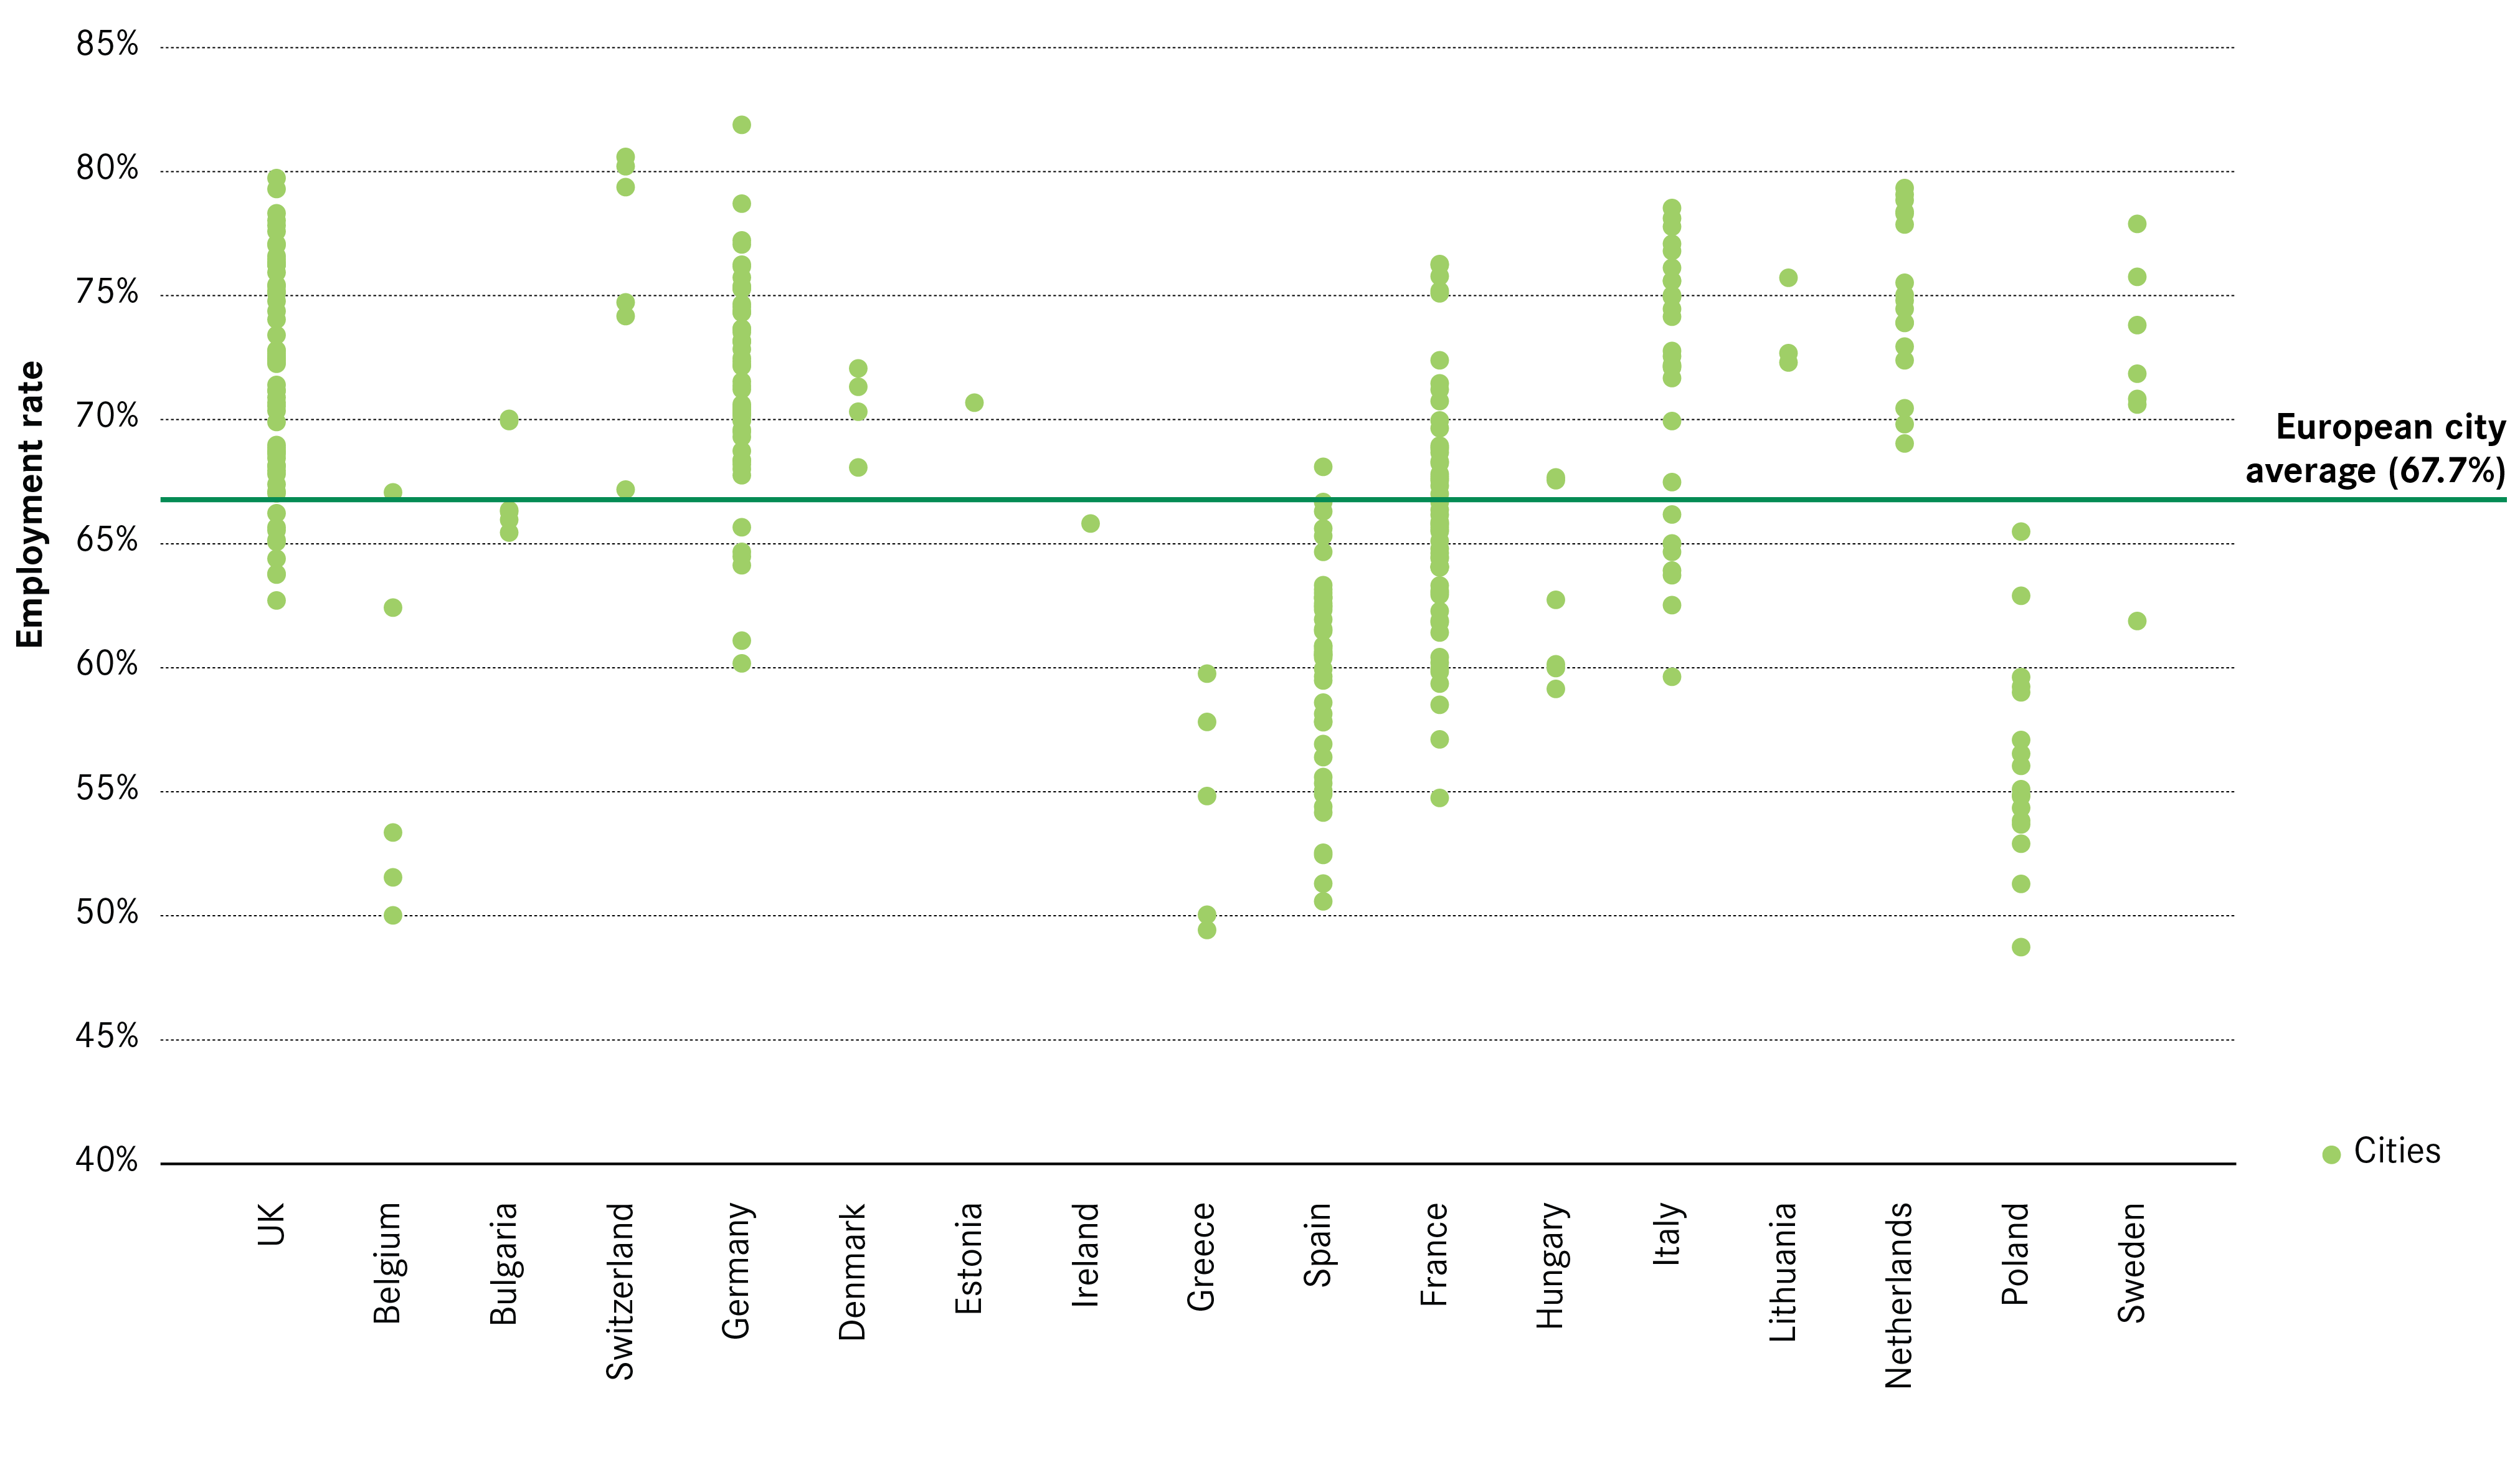
As shown in Figure 16, 52 out of 63 UK cities have a higher employment rate than the European city average (67 per cent of the active population). Only one city, Blackburn, is in the European bottom 25 per cent with an employment rate of 63 per cent. There is a similar pattern in Germany, where 50 out of 56 cities have a higher employment rate than the European average. But there is a greater amount a variation across German cities, with Ingolstadt having an employment rate of 82 per cent (the highest in Germany), and Heidelberg a rate of 60 per cent (the lowest). In France, less than half of the cities perform better than the European average (22/55) and only one of the 47 Spanish cities (Lleida) was above the average.
Figure 16: Distribution of cities by employment rate, 2011
Productivity
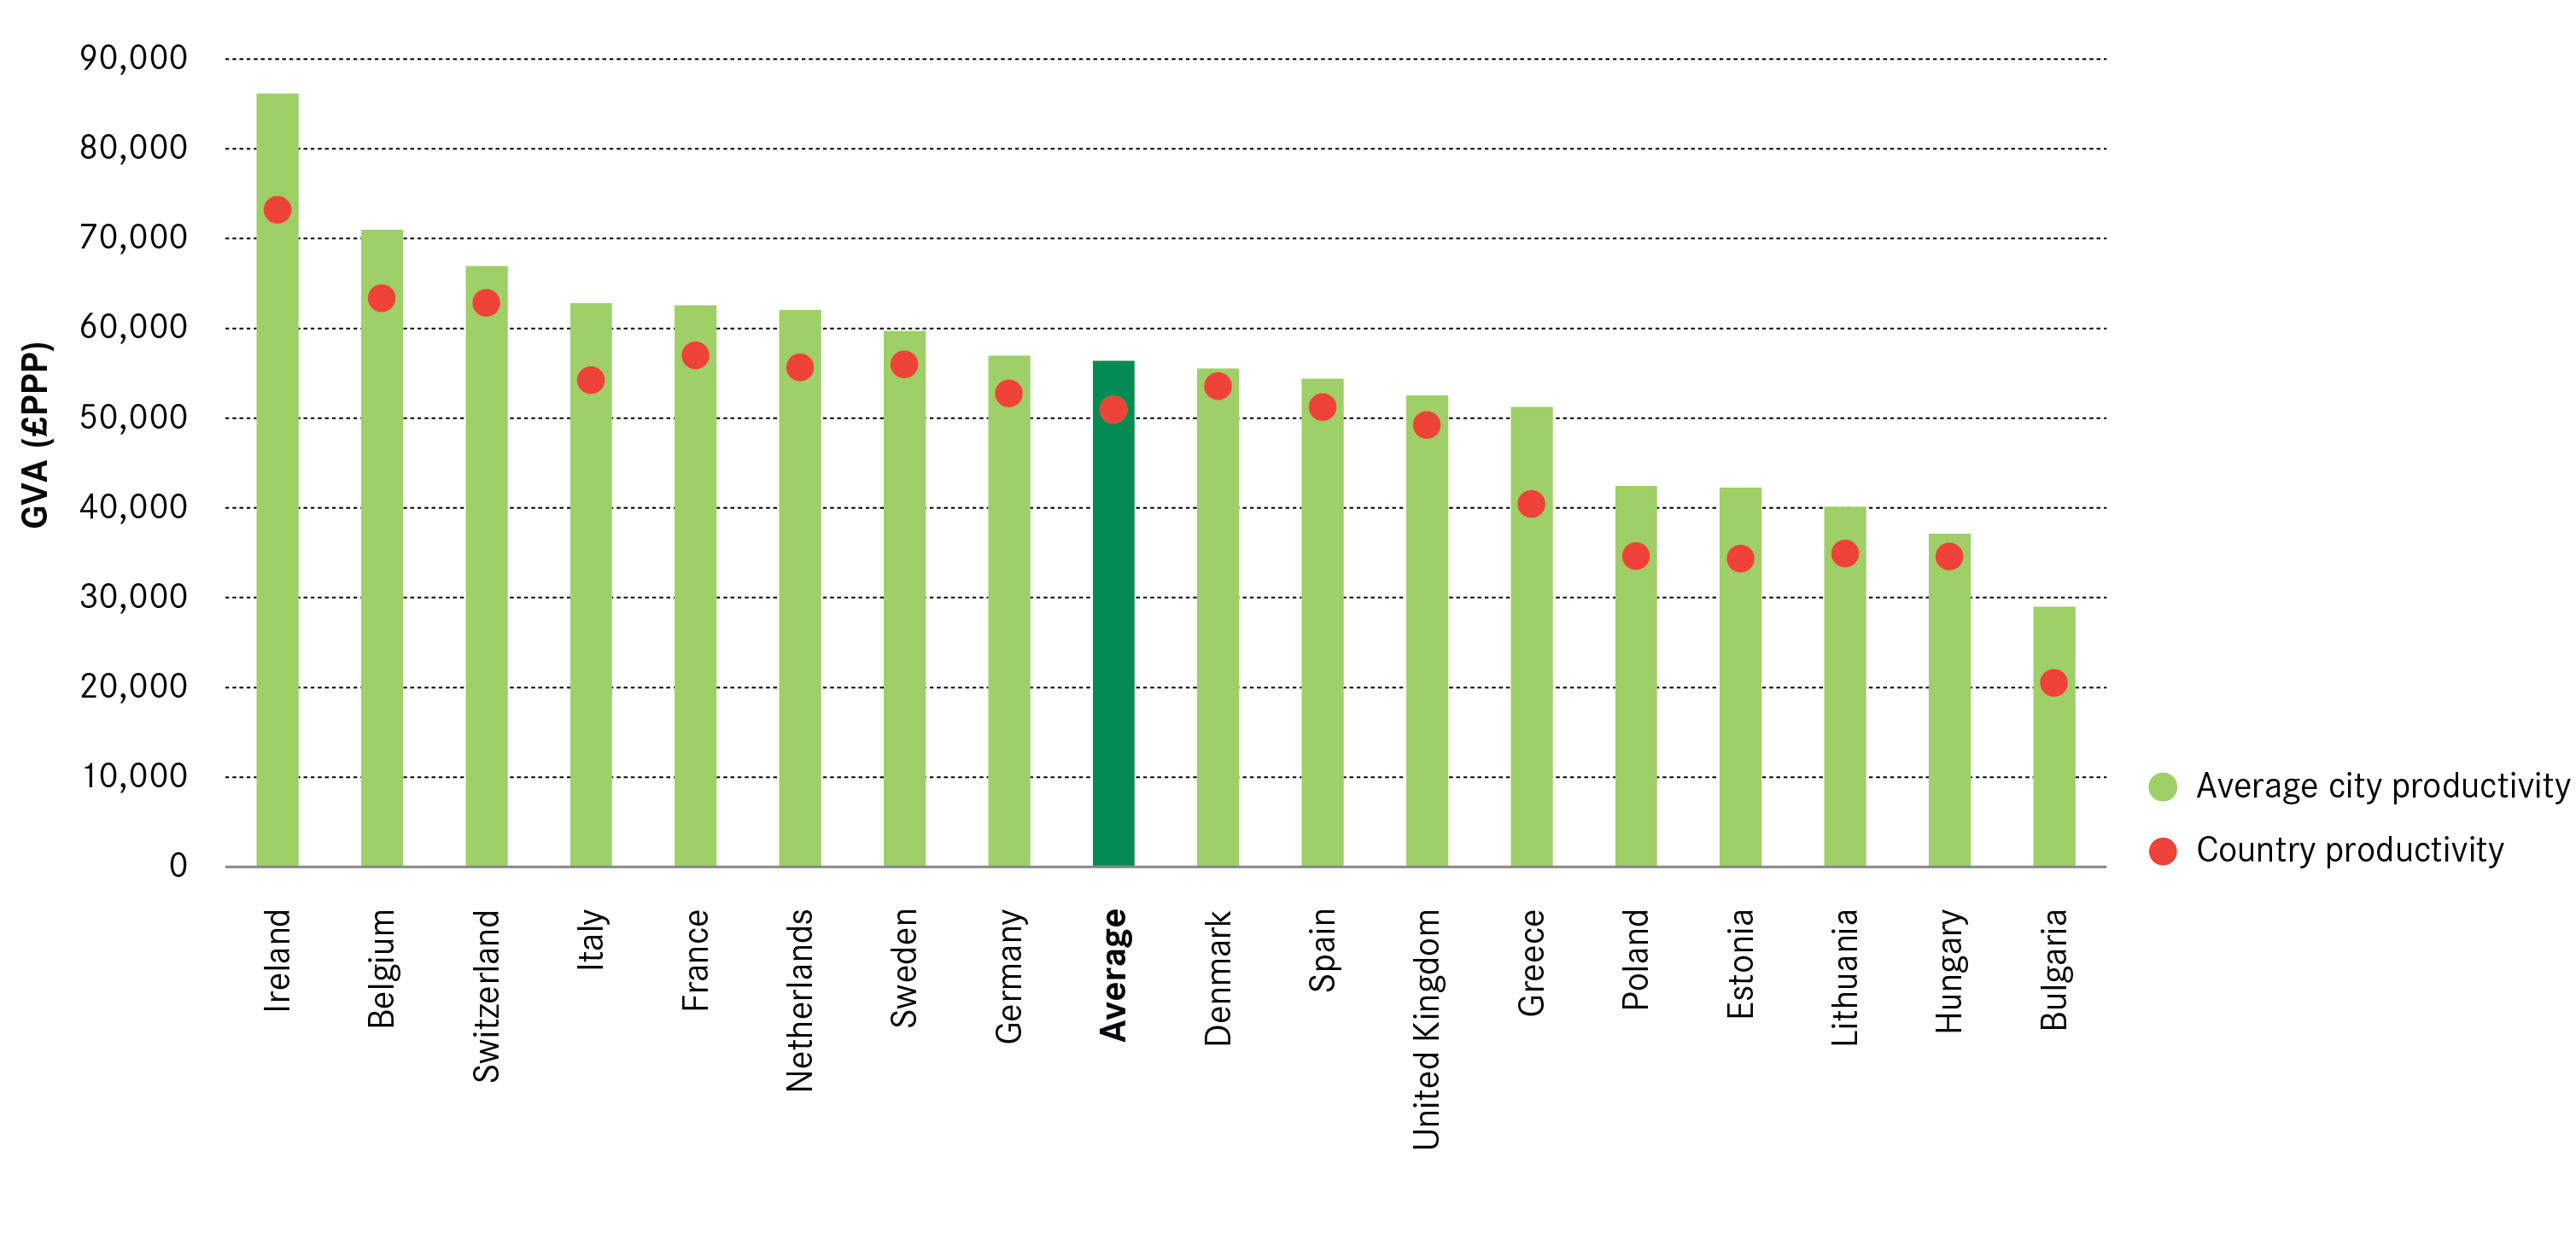
Although UK cities account for a large share of the output of urban Europe, they tend to be much less productive. As shown by Figure 17, UK cities’ average productivity is around £52,500 (in £PPP), which is lower than the average European city productivity (£56,300). In Western Europe, Belgian cities have an average productivity of £71,000, while in German cities this is around £57,000. These figures are consistent with the productivity of national economies: in 2011 GVA per worker in the UK was £49,198, which was lower than any western European economy, and around £2,000 lower than the 17 country average.
Figure 17: Average city and country productivity, 2011
Only six UK cities have a higher productivity than the 330 European cities average – London, Slough, Reading, Milton Keynes, Aberdeen and Aldershot. Meanwhile more than half of UK cities (38) are among the 25 per cent of cities with the lowest productivity.
Figure 18: Productivity across Europe, 2011

As shown in Figure 18, the UK’s most productive cities are located in the Greater South East. In other countries the most productive cities seem to be clustered in specific areas too. For instance Germany has several productive areas: along the Rhine river (among which Dusseldorf, Cologne and Bonn for the Rhine Ruhr, but also Frankfurt, Mannheim and Stuttgart), in the south-eastern Lander of Bavaria (Munich, Ingolstadt, Regensburg) and in some large cities in the North (Bremen, Hamburg). In France, the most productive cities are either the largest (Paris, Lyon, Marseille, Toulouse, Nice) or small cities located around Paris (St-Quentin-en-Yvelines, Versailles, etc). In Italy, the most productive cities are typically small or medium-sized and locate in the northern part of the country.
On the other hand, the map also reveals a clustering of low-productive cities in the north of England, with city productivity ranging from £30,700 to £44,400. Putting aside a few exceptions, cities with a similar level of poor productivity can only be found in the East of Germany and in Eastern Europe.
Box 3: The “productivity puzzle”
As in most European countries, labour productivity in the UK declined as a result of the 2007/08 recession. But while it has picked up elsewhere in the years since, it has continued to stagnate in the UK. In 2014, the level of productivity was 20 percentage points below the average for the G7 economies.14
The Bank of England estimated that the UK productivity in 2014 was 16 percentage points lower than it should have been if the pre-crisis trend had carried on.15 4 percentage points are considered to be caused by mismeasurement issues, 3 to 4 are estimated to be due to reduced investments in capital, and 3 to 5 in slow reallocation of resources and higher firm survival rates during the crisis.
Industrial structure and productivity
Figure 19 compares the productivity of UK cities against that of their closest European neighbour in terms of industrial structure. For each UK city the proportion of jobs in each sector of the economy is compared with that of each other European city of similar size to find the closest match.
Figure 19: Productivity comparison of UK cities to European most similar city, 2011
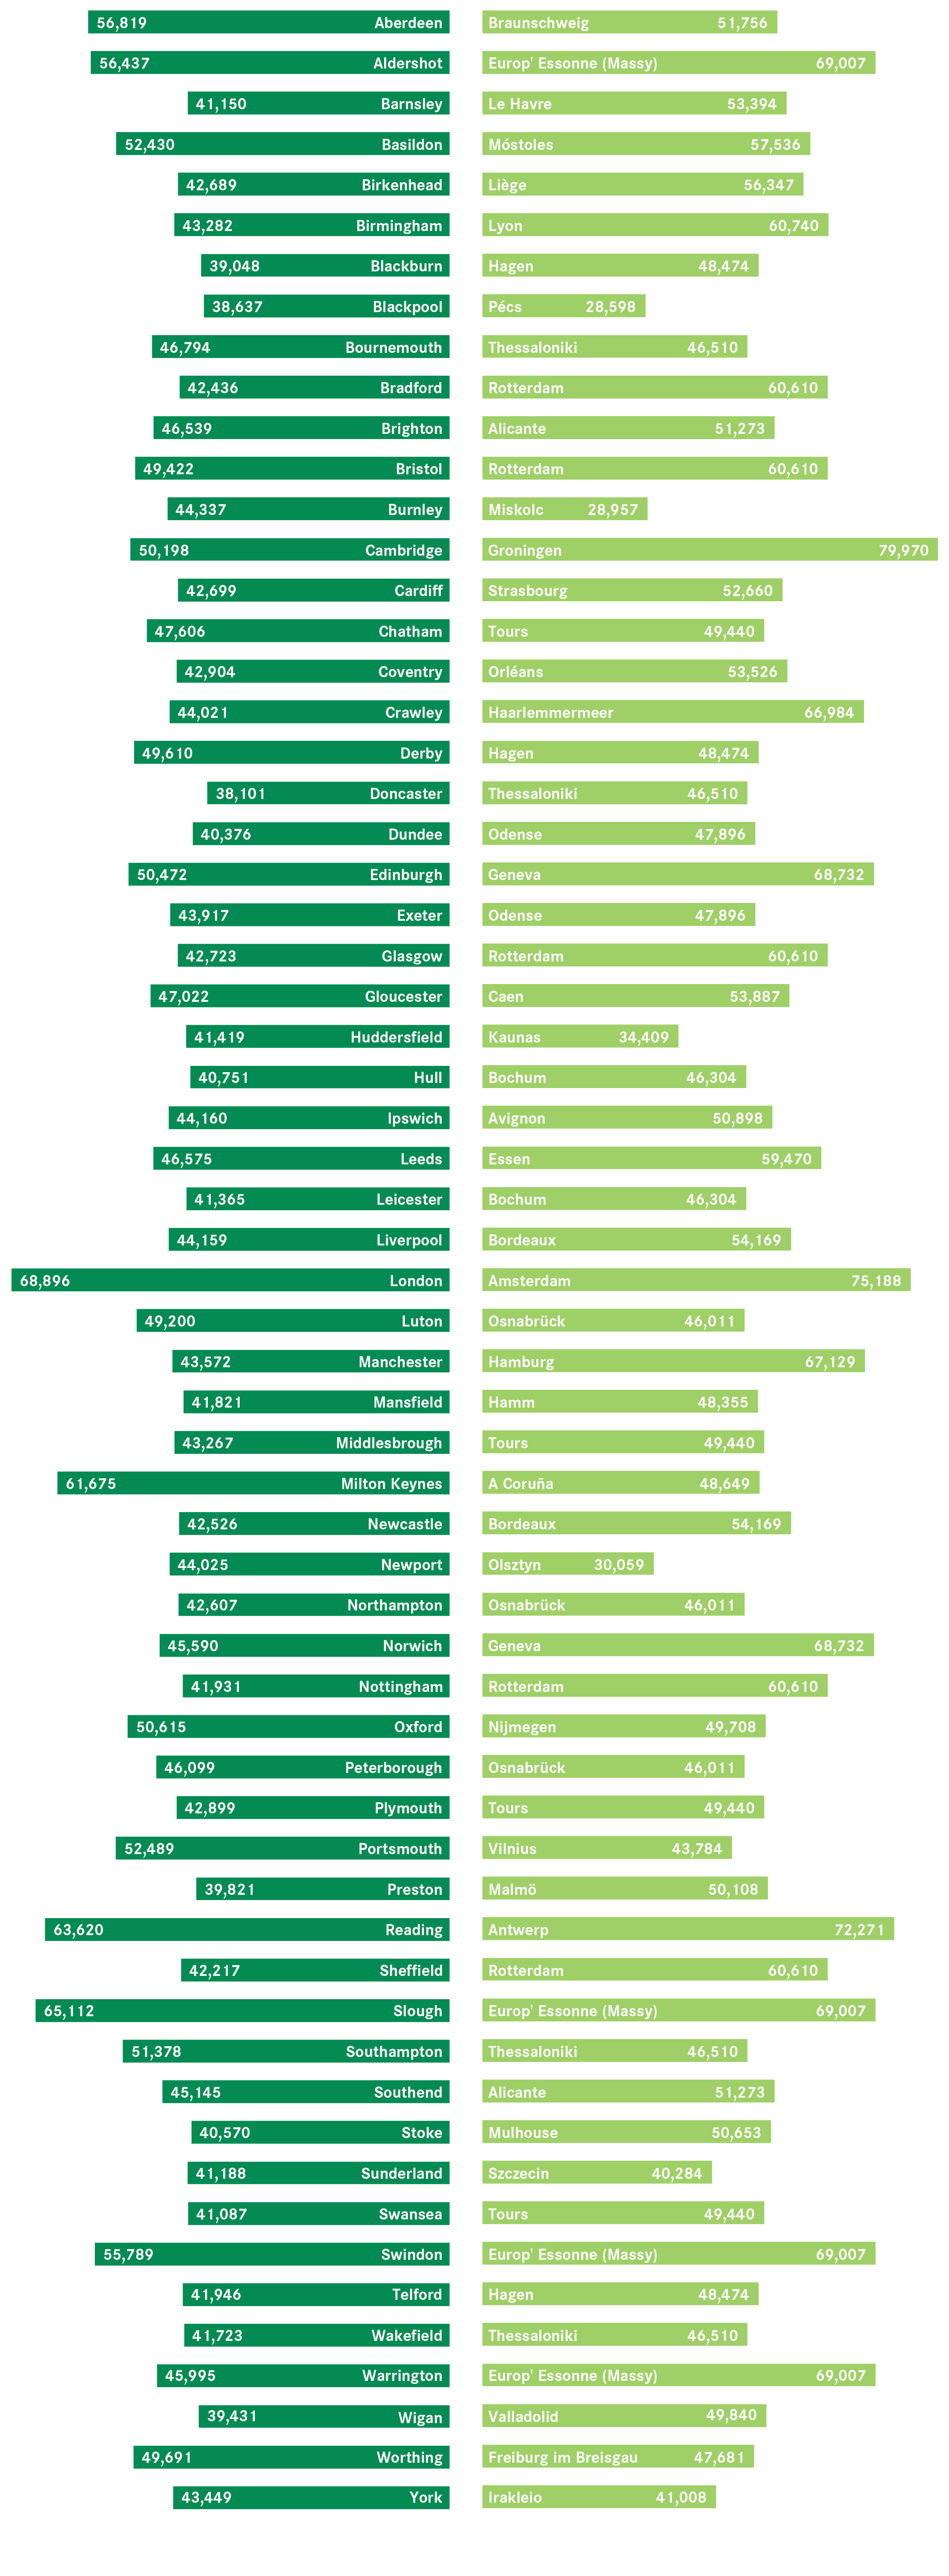
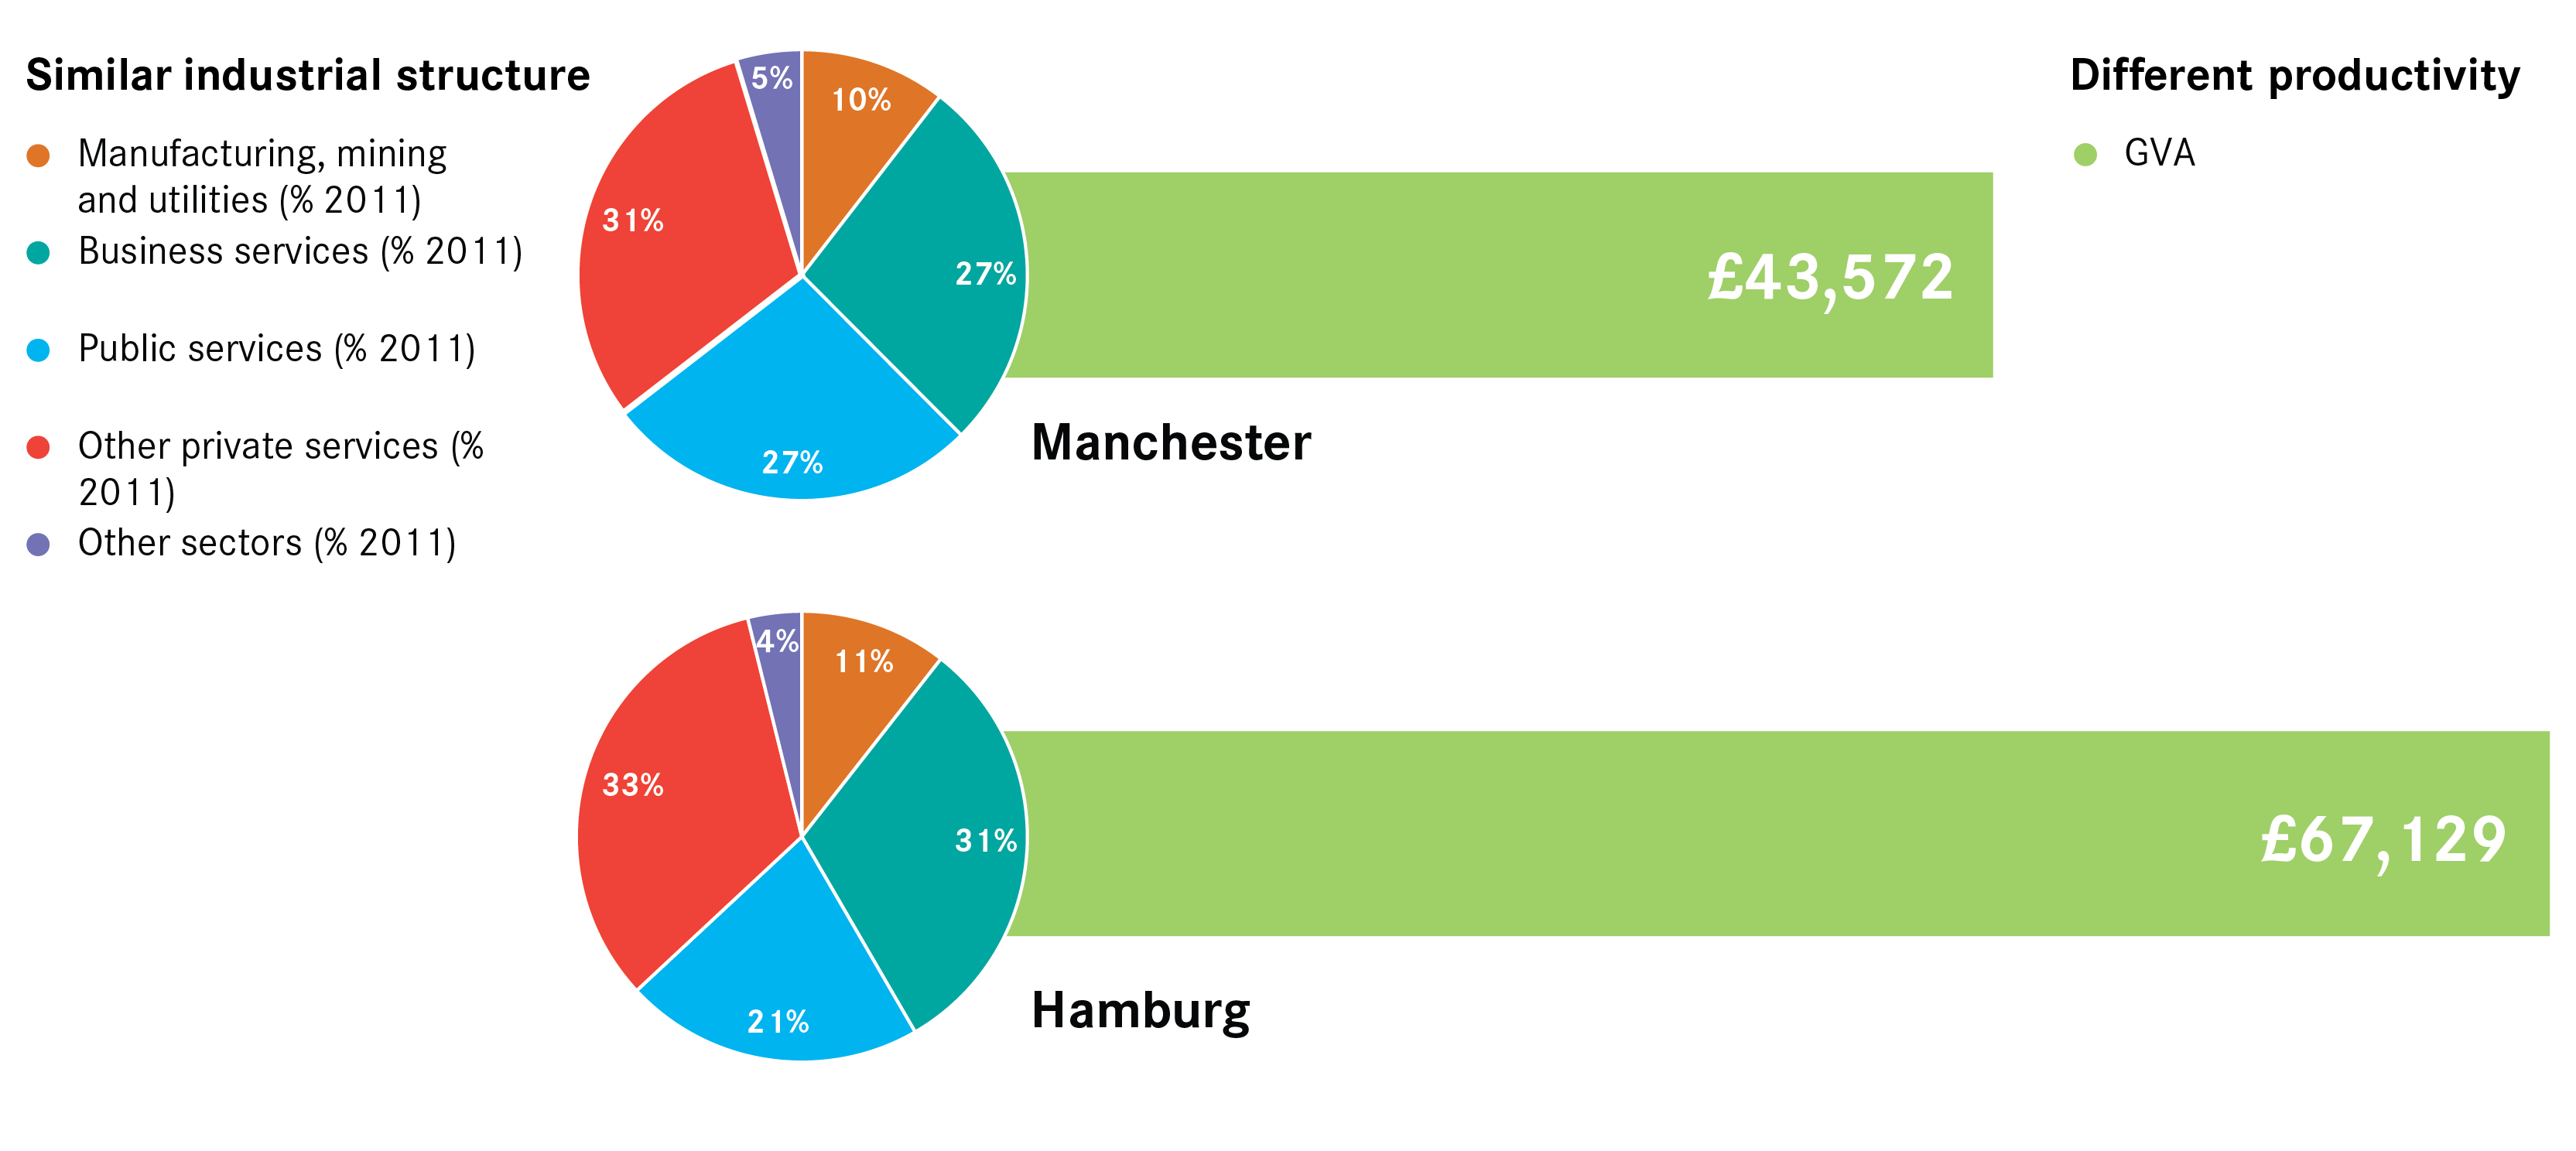
The index shows that 46 of the 62 UK cities have a lower productivity than their ‘twin’ city. This means that, for a similar economic structure, these cities produce less output per worker than their nearest comparator. For example, despite their similar economic structure, productivity in Manchester is 35 per cent lower than in Hamburg (Figure 20).
Figure 20: Industrial structure and productivity in Manchester and Hamburg, 2011
Large cities are punching below their weight
In general larger cities tend to have higher productivity than smaller ones: the 65 European cities with more than 500,000 inhabitants have an overall productivity of £59,600, whereas the European city average is £56,300. But this does not seem to be reflected in the UK (Figure 21).
Figure 21: Large EU cities by productivity, 2011
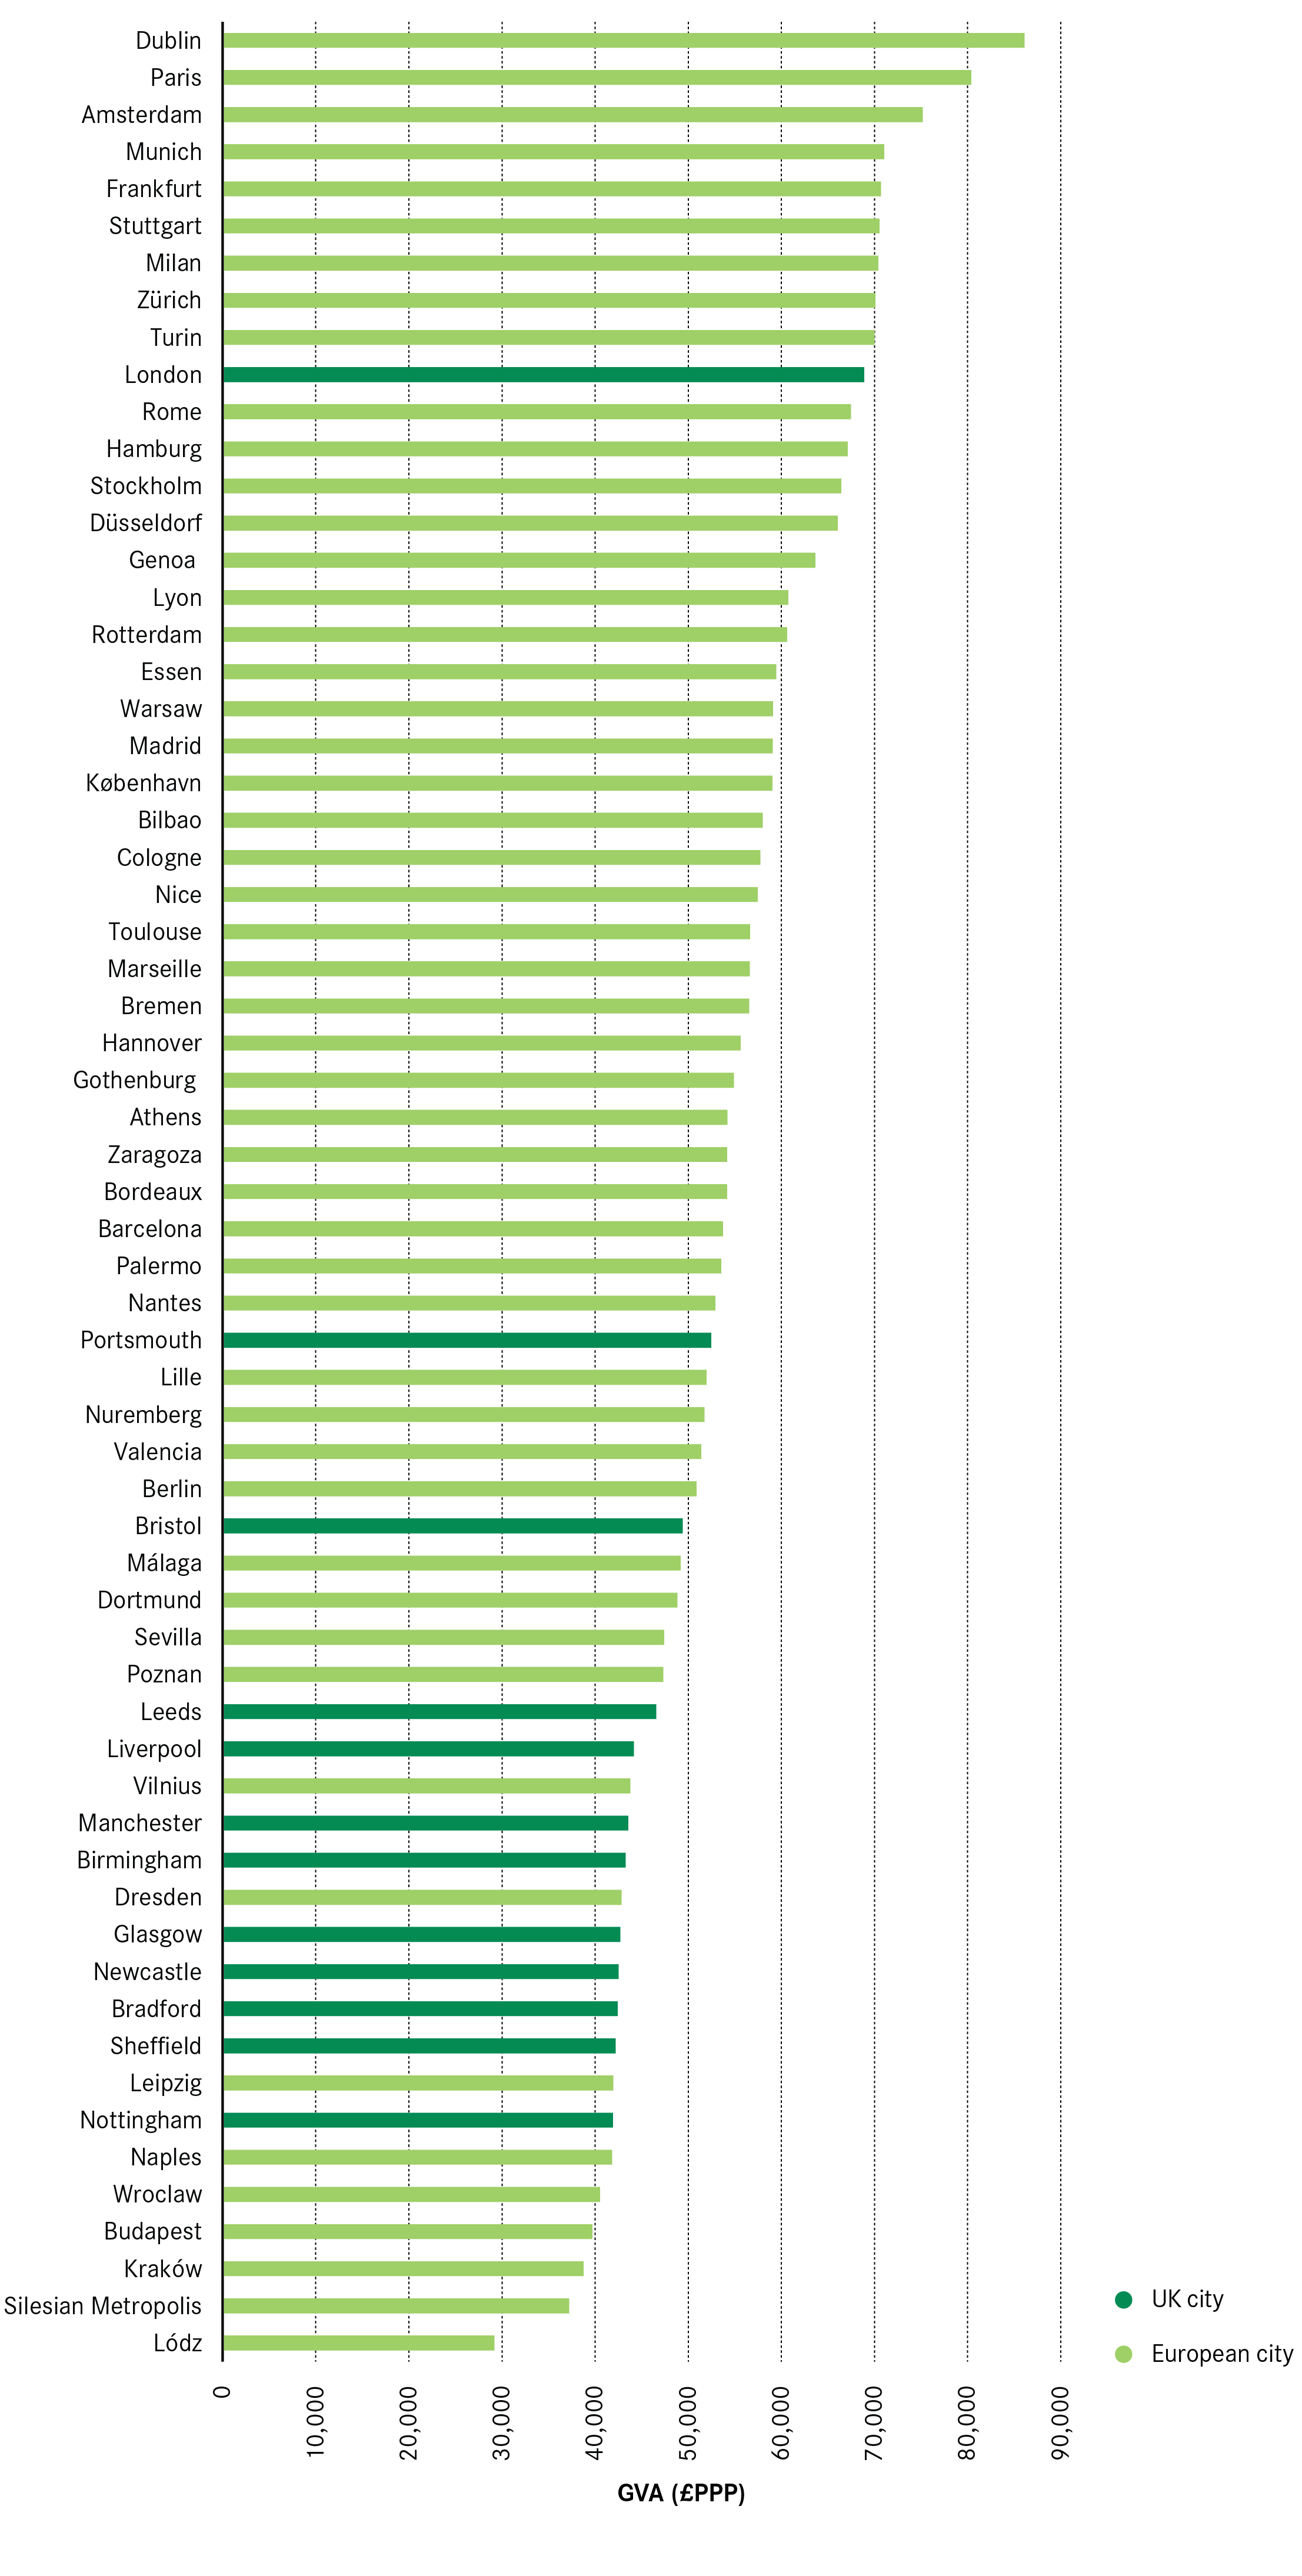
Among the 12 UK cities with more than 500,000 inhabitants, only three – London, Bristol and Portsmouth – have a higher productivity than the national average, and only London has a higher productivity than the European city average.
In other countries, large but less-productive cities are relatively rare. For instance in Germany, nine of the 14 cities of more than 500,000 inhabitants have a higher productivity than the national average, and eight perform better than the European city average. In Italy, four of the six largest cities have a higher productivity than the national and European city averages. In France, three of the eight largest cities are above the national average but five are above the European city average.
This result reflects research by the OECD, which found that larger cities tended to be more productive than their national averages, apart from the UK. This suggests that large cities in particular in the UK are failing to realise the benefits of agglomeration compared to their European counterparts.