
02The future of work in cities
Artificial intelligence, automation and other technological changes are among the biggest economic issues of our age. They featured in the opening remarks of the Chancellor’s recent Budget speech and are identified as one of the ‘Grand Challenges’ in the Government’s new Industrial Strategy.
“The world is on the brink of a technological revolution. One that will change the way we work and live and transform our living standards for generations to come. And we face a choice: either we embrace the future, seize the opportunities which lie within our grasp and build on Britain’s great global success story, or reject change and turn inwards to the failed and irrelevant dogmas of the past.”
Philip Hammond, Budget speech 2017
In contrast to the Chancellor’s bullish tone, much of the focus of the debate around automation and technological change to date has been on the potential job losses these trends are likely to cause. Yet much less work has been done on the impact of current technological and non-technological trends on different places across the country and their potential to create jobs for the future.
By 2030, technological advancements – combined with globalisation and changes to the make-up of the country’s population – will have brought significant changes into the labour market, with big implications for policy-makers. However, a point that is often missed is that this change is not new, but an ongoing process. Indeed change has been a good thing, bringing with it innovations and improvements in standards of living.
But as this chapter will show, the problem with the policy response to change in recent decades is that it has not effectively supported all cities to adapt to this ongoing evolution. This means that some people and places have benefited more from this evolution than others.
To inform discussions at the national and local level, this chapter looks at the likely impact of automation and other trends on cities across Great Britain, identifying where job losses are most likely and which places are best placed to see growth in new areas.
Box 2: Methodology
This work builds on the research undertaken by researchers at the National Endowment for Science, Technology and the Arts (Nesta) and Oxford Martin.
In The future of skills: employment in 2030 report, Nesta used an innovative mixed-methods approach, combining expert human judgement with machine learning to estimate how technological and non-technological trends will affect the demand for different bundles of skills, and so employment in the future.
The probabilities estimated by Nesta of the likely increase in demand for minor occupation groups (SOC 3 digits) were then combined with labour market information for each city, to make estimates about jobs likely to increase and decrease in different parts of the country.
The composition of the labour market in each city was built using data from the 2011 Census and the Business Register of Employment Survey (BRES). Data from the Census provides a detailed breakdown of minor occupation groups that is not available in BRES. In order to have the most recent data possible, estimates on the 2016 workforce in each minor occupation group were created by combining data in the Census with the most updated information on broad occupation groups available in BRES.
Cities and the risk of job losses
The job market will look very different in 2030.
As Nesta identifies in The future of skills: employment in 2030, a number of factors, such as technological changes, globalisation and demographic changes will affect employment, reducing demand for some occupations and increasing it for others. Generally, those jobs that are made up of routine tasks are at a greater risk of decline, whereas those occupations requiring interpersonal and cognitive skills are well placed to grow.
Nesta’s study looks at the likely impact for the UK as a whole and finds that there are likely to be more jobs nationally in 2030 than today. But this is likely to play out differently across the country. In what follows, Nesta’s estimates are applied to Britain’s cities to see how these impacts are likely to be felt in different places. Box 2 outlines the methodology used.
Overall, one in five jobs in cities across Great Britain is in an occupation that is very likely to shrink. This amounts to approximately 3.6 million jobs, or 20.2 per cent of the current workforce in cities.
However, the risk is not evenly spread across the country, and cities outside the south of England are more exposed to job losses.
In places like Mansfield, Sunderland, Wakefield and Stoke almost 30 per cent of the current workforce is in an occupation very likely to shrink by 2030. This contrasts with cities such as Cambridge and Oxford where less than 15 per cent of jobs are at risk (see Figure 3).
Box 3: Displacement in big cities
While big cities are relatively less exposed to occupations likely to shrink, they are likely to see a great deal of disruption. For example, London and Worthing have a similar share of jobs likely to see a decrease in demand (16.1 per cent in London, 16.0 per cent in Worthing), but this translates to around 908,000 jobs in London – 25 per cent of all jobs at risk in cities across Great Britain – and only 8,400 jobs in Worthing, which is just 0.2 per cent of all jobs at risk in cities.
Figure 3: Share of jobs in occupations likely to shrink

Box 4: What types of jobs are at risk?
The majority of jobs at risk are in a handful of occupations. Nesta identified 36 minor occupation groups likely to shrink in the future, but 53 per cent of all jobs at risk in cities are just in five occupations (see Figure 4).
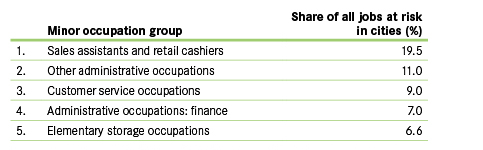
Sales assistants and retail cashiers is the occupation group most at risk – as a whole, one in five urban jobs in this occupation is deemed at risk of displacement. And it is the most at risk occupation in all but three cities, with only Exeter (where 21.2 per cent of jobs at risk are in customer services occupations) and Milton Keynes and Wakefield (where the biggest share of jobs at risk is in elementary storage occupations -16.9 per cent and 17.9 per cent respectively – reflecting their large distribution sectors) proving the exceptions.
Other at-risk occupations are also notable in a handful of other cities. In Oxford and Swindon, assemblers and routine operatives make up a significant share of all jobs at risk (respectively 10.4 per cent and 9.8 per cent). In Aberdeen, plant and machine operatives account for 7.4 per cent of all jobs likely to see a decrease in demand and in Huddersfield, process operatives represent 10.7 per cent of all jobs at risk.
Overall though, in most cities, jobs at risk are concentrated in a small number of occupations. 70.2 per cent of all jobs at risk in Worthing are in just five occupations, and even in Aberdeen – the city where the top five occupations make up the lowest share of jobs at risk– they still represent 44.1 per cent of all jobs at risk.
Source: Bakhshi et al. 2017, Future of Skills: Employment in 2030, London: Nesta and Pearson; ONS 2017, Business Register of Employment Survey; Census 2011.
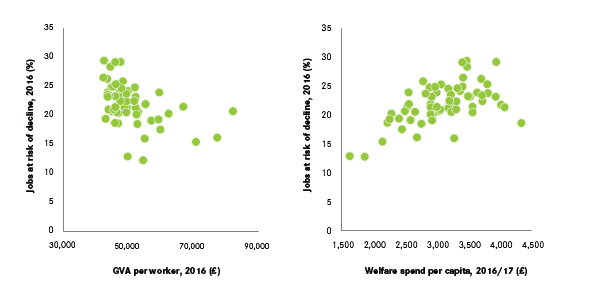
Today’s weakest performing cities are also those most exposed to the risk of job losses in the future. Mansfield, Stoke, Doncaster and Blackburn not only feature among the top 10 cities where jobs are most at risk, but they are also among the bottom 10 cities in terms of productivity (GVA per worker). In contrast, Oxford, London and Reading, the three cities with the lowest share of jobs likely to shrink, are among the most productive cities of Great Britain (see Figure 5).
Cities with a higher risk of job losses also tend to have a higher welfare spend per capita (see Figure 5), a lower share of jobs in knowledge intensive business services (KIBS) and a lower share of high-skilled workers.
Figure 5: The relationship between jobs at risk of decline, productivity per worker (left) and welfare spend per capita (right)
Cities and past trends in the labour market
While the potential job losses set out will pose a challenge, history shows that cities were exposed to a similar risk of job losses a hundred years ago resulting from both automation and globalisation. Despite this, most have been able to bounce back and grow.
Automation has a long history of reshaping the way people work.
The impact of automation and the political reaction to it stretch back to the nineteenth century with the Luddite protests against the introduction of machines into the textile industry.
Cities are no more at risk of automation today than they were a hundred years ago.
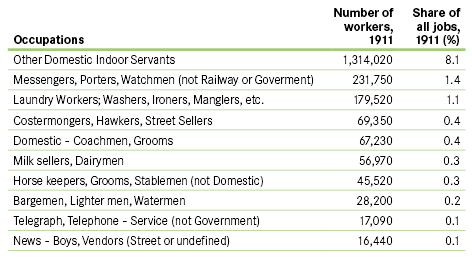
Data from 1911 suggests that, in aggregate, a number of occupations that employed many people a century ago have almost disappeared as a result of machines. For example, laundry workers have mostly been replaced by washing machines and demand for domestic servants has fallen with the rise of electrical domestic appliances. Automation and innovation have also changed the way people shop, and the creation of large supermarkets means that street sellers in city centres or milk floats gliding down residential streets at dawn are a rare sight today.
By picking out a selection of these occupations (see Box 5), it emerges that the current challenges faced by cities are not so different from those faced a century ago. As an illustration, these occupations alone (listed in Figure 6) used to employ around 12.4 per cent of the total English and Welsh workforce in 1911. Given that this is just a subset of affected occupations, the total share of jobs affected by automation is likely to have been even higher.
Interestingly, as Figure 7 shows, it was southern cities that were most exposed to automation of these sectors. In Bournemouth, Oxford and Brighton the share of the workforce affected by those changes was above 20 per cent. In contrast, that share was less than 5 per cent in Burnley, Blackburn and Preston.
Globalisation also had a big impact on the labour market, and on mining and manufacturing in particular. Unlike the pattern for automation, it was cities further north that were more exposed to this (see Figure 7). In 1911, 60 per cent of jobs in Barnsley were in mining and manufacturing, while in Coventry it was 61 per cent. A century later it was 13 and 11 per cent respectively.
Box 5: The rise and fall of occupations in the last century
In 1911, approximately 10 per cent of the workforce in cities in England and Wales was employed as a domestic servant or laundry worker. However, the advent of electrical appliances such as washing machines and vacuum cleaners helped make these occupations less and less relevant throughout the century.
Within just 50 years, the share of workers employed in these jobs decreased dramatically. The number of laundry workers decreased by 34 per cent between 1911 and 1951, and the number of domestic servants fell by 67 per cent. Nowadays, these occupations only play a very marginal role in terms of employment.
The shift away from these two occupations affected a larger share of workers in Bournemouth, Oxford, Southend and Cambridge than elsewhere. In these places, more than 15 per cent of the 1911 workforce was involved in these occupations. In contrast, the decline of laundry workers and domestic servants had a minimal impact on Burnley, Blackburn and Preston, as less than 3 per cent of the whole workforce in these cities was employed in those occupations.
Figure 6: Jobs that have mostly been replaced by automation
Box 6: Defining occupations in 1911
The 1911 Census has detailed data on occupations for administrative areas with populations over 5,000. To understand how history has affected the performance of modern cities, this data was matched to current Primary Urban Area boundaries. In most instances, data is available for the core urban authority only, while some cities have no data available. In total, it was possible to look at 40 cities across England.
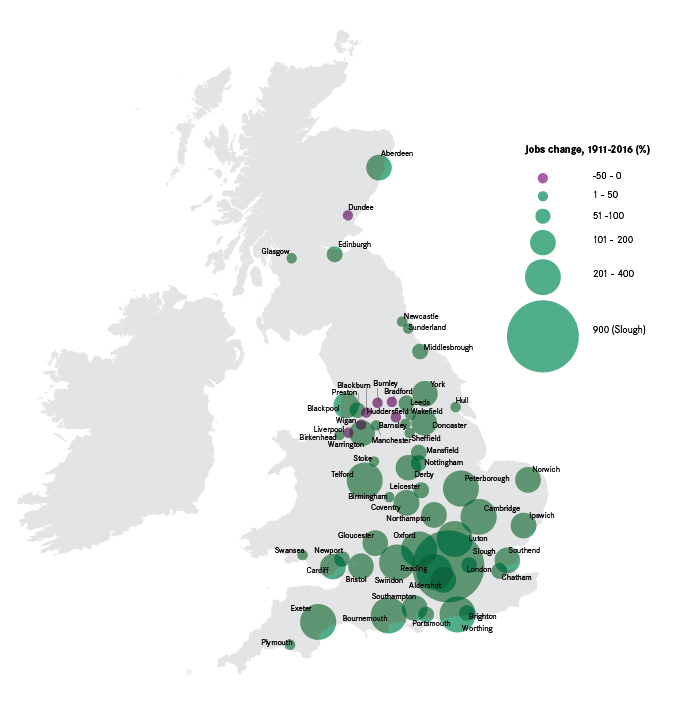
But crucially, despite the pressures of automation and globalisation, most cities have seen jobs growth over the last century (see Figure 8). 52 cities have more jobs now than they used to in 1911; and 27 cities more than doubled their workforce. Meanwhile seven cities have seen a decline in jobs over time.3 There is a clear geography to this, with southern cities growing more than cities in the north.
Figure 7: Share of all jobs at risk because of automation and globalisation 1911
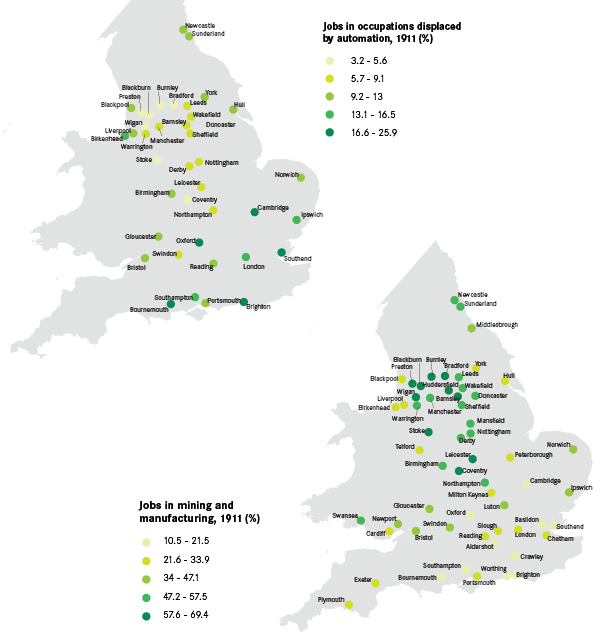
Figure 8: Growth in jobs, 1911-2016
Cities and jobs likely to see an increase in demand to 2030
As has happened over the last century, the labour market will continue to evolve – new occupations will arise and some occupations that already exist will become increasingly important.
It is hard to anticipate what the jobs of the future will look like and where in the country they will be created. However, what can be observed is where the jobs likely to experience an increase in demand are currently located, showing how successful cities have been at attracting these jobs to date, with implications for their ability to continue to do so in the future.
All cities are likely to see job creation to 2030
Looking at the locations of jobs that Nesta predicts will grow in the future shows that these occupations are currently more evenly spread across the country than those at risk of decline. With the exceptions of Oxford, Cambridge and Brighton, where the share of jobs likely to grow is slightly higher, these occupations currently account for between 5 and 10 per cent of all jobs. And there is no particular geography to these figures. This suggests that all are well placed to see job creation occur in their economies in the future.
Box 7: The current composition of jobs likely to grow in the future
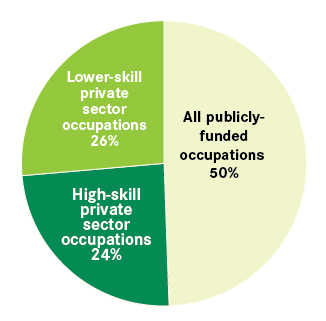
Half of the jobs very likely to experience an increase in demand according to Nesta’s estimations are currently in publicly-funded occupations, whereas the remaining fifty per cent is almost evenly divided into high-skilled and lower-skilled private sector occupations (see Figure 9).
Growing demand for publicly-funded activities in the future is driven by demographic shifts and expectations around increased demand for lifelong learning, with an impact on higher-skilled public sector occupations. Demand will not just grow for high-skilled jobs though – some non-routine lower-skilled jobs in the private sector are also expected to grow as a result of increased demand for services in areas such as sports and fitness.
Figure 9: Occupational breakdown for existing jobs likely to grow to 2030
But while these jobs are fairly evenly spread as a whole, the composition of these jobs across cities looks very different (see Figure 10). There are three points to note. Firstly, publicly-funded activities4 (e.g. in health and welfare) currently account for a large share of jobs projected to grow (see Box 7). Ongoing demographic changes suggest that publicly-funded jobs will continue to play an important role in future job creation.
Secondly, variation is greater between higher and lower-skilled jobs in the private sector. In Cambridge, close to half of all jobs expected to see an increase in demand are currently in high-skilled occupations, such as natural science professionals, while in Aldershot this figure is one in three. This stands in stark contrast with a number of cities further north. In Blackburn, Sunderland and Bradford, around one in 10 of these jobs is currently in higher-skilled private sector occupations, with lower-skilled jobs in the private sector, such as in food preparation and hospitality, having a much larger share (see Figure 10).
Thirdly, those cities that currently have a larger share of high-skilled private sector jobs that are likely to grow are also likely to be more insulated from job declines (see Figure 11).

Figure 11: Jobs likely to decline and the composition of jobs likely to increase

While once again it is difficult to predict how exactly these three categories of jobs will grow in the future, the past does give us some indication as to what may happen.
Since 1951, the public sector has played an ever larger role in the national economy, driven by changing demographics, healthcare provision and rising demand for education. Between 1951 and 2011, the share of jobs in publicly-funded activities rose from 13 per cent to 29 per cent.
But there has been a great deal of variation around this figure across cities. Those places where the increase in publicly-funded jobs has been the highest are among the weakest performers today. In 29 out of 62 cities across Britain – mostly concentrated in the north and midlands – the share of jobs accounted for by publicly-funded sectors has increased by more than 20 percentage points in the last 60 years. In Blackburn it increased by 27 percentage points, and in Dundee it increased by 30. Increasingly the public sector has compensated for the sluggish performance of the private sector in these places. And where private sector jobs have been created they have tended to be lower skilled, and thereby lower paid.
In contrast, cities in the Greater South East in particular have mostly experienced a smaller shift towards publicly-funded jobs,5 and a greater share of their private sector jobs growth has been in high-skilled, knowledge-intensive occupations, some of which have been created as a result of innovations in technology. For example, IT professionals and technicians, occupations that did not exist 60 years ago, are mostly concentrated in and around cities in the Greater South East. Similar patterns are seen for jobs in fund management, advertising and market research.
Over the last 100 years, the evolution of the economy has meant that the ability to access and use knowledge has become increasingly important for businesses, people and cities. Those cities that have best been able to provide access to knowledge are the ones that have best been able to deal with change over the last century.6
These patterns have occurred because of the relative advantages that different cities offer. The location decisions made by businesses are based on the trade-off between the availability of skilled workers, access to knowledge and cost of land.
As noted in the first chapter, high-skilled businesses look for locations that offer them access to knowledge – both through the availability of highly-skilled workers and, for services businesses in particular,7 a network of high-skilled businesses. Cities such as Reading and London offer both of these advantages, and this is reflected in the types of jobs they have attracted in spite of the higher cost of commercial space in these cities.8
Businesses undertaking lower-skilled, more-routinised activities (such as in call centres or warehousing) look for different attributes, namely access to a lower-skilled workforce and cheaper land. Cities such as Barnsley and Swansea offer these types of benefits, making them more appealing to lower-skilled businesses than higher-skilled ones. The result is that the business investment they have attracted in recent years has tended to create lower-skilled work. And the analysis above shows that these cities are more at risk of job losses due to changes in the labour market.
Without any change to the benefits that places offer to businesses, then it is likely that job creation in the future will match that seen in recent decades. This will mean that while most places will likely see jobs growth, some will replace routinised jobs lost due to changes in the labour market with more lower-skilled jobs. These tend to be less productive and less innovative, putting them at continued risk over the longer term.
Policy has not focused on helping people and places to adapt
As well the public sector playing an ever larger role in job creation in weaker economies, it has also compensated those people who have seen their jobs disappear as a result of automation and globalisation. As Figure 12 shows, there is a positive relationship between the change in share of jobs accounted for by publicly-funded activities and the share of working-age people on long-term incapacity benefit.
These policy choices have helped cushion the impact of substantial changes in city economies, and the creation of publicly-funded jobs has no doubt been a good thing in terms of increasing employment opportunities available in weaker labour markets.
But what they have not done is help people and places adapt to changes in demand for workers. This has had an impact on the relevance of skills available in these cities, especially among workers that have been affected by previous waves of change, with a knock-on impact on how attractive a city is to investment from higher-skilled business activities. Looking at the qualifications levels of those aged between 50-64 in 2016 shows that a much higher share of this age group tend to have no formal qualifications at all in cities in the North. Liverpool leads this list, with 26 per cent of 50-64 year olds having no formal qualifications, followed by Stoke and Birmingham (both 22 per cent). In contrast this figure is just 6 per cent in Swindon, and 7 per cent in Bristol (see Figure 13).
The outcome of this difference in skills across cities is that while jobs have increased across the country, in weaker economies this has meant an increasing reliance on public sector and lower-skilled jobs in the private sector (e.g. administration or food preparation). This has led to a divergence in standards of living across the country, entrenching economic divides, as summarised in Figure 14.
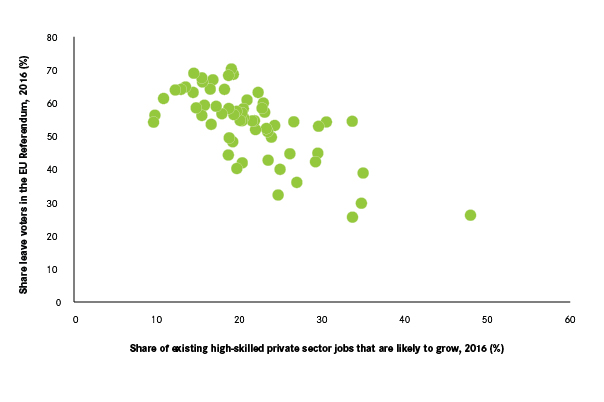
The increasing economic divides explain at least in part the recent political divides that have opened up across the country. One of the most common explanations put forward for the EU Referendum result was that it was a protest by people in ‘left behind’ places who felt that they had been ignored by politicians. Figure 15 shows a negative relationship between the referendum result and the share of jobs projected to grow which are high-skilled. The implication is that if patterns of job creation in the future reflect those of the past then the political divide illustrated by the referendum result will likely grow wider.
Figure 12: The relationship between incapacity benefits and publicly-funded jobs
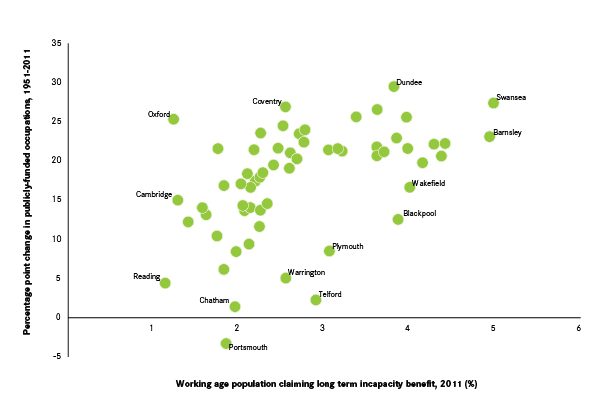
Figure 13: Share of 50-64 year olds with no formal qualifications
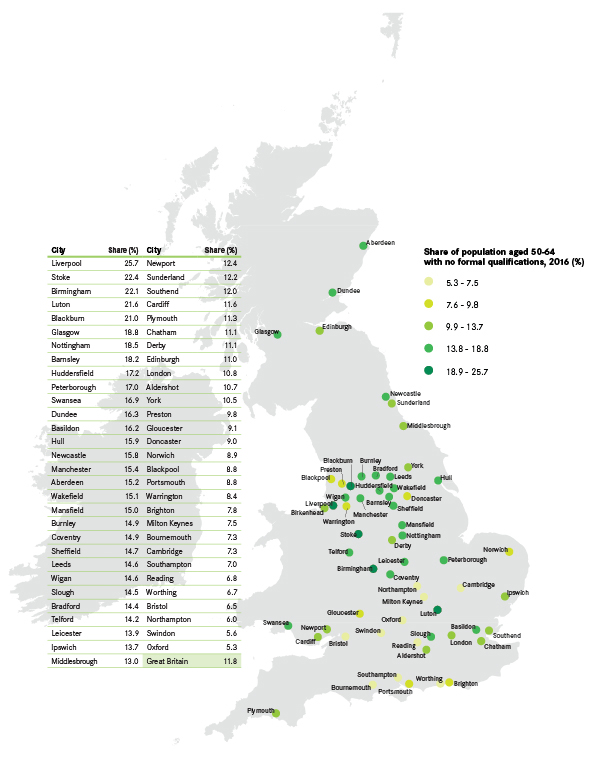
Figure 14: Differences in economic outcomes between cities in the South and cities elsewhere in Britain
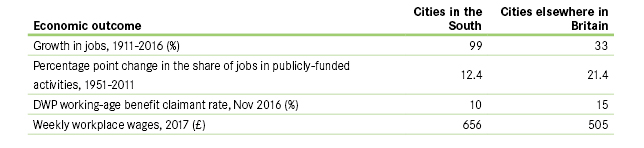
Figure 15: The EU Referendum result and share of jobs likely to grow that are in higher-skilled private sector activities
Policy implications
The policy response to the changing nature of work in recent decades has not prepared those people and places most affected by these changes to adapt to them. Policy has not sufficiently understood why businesses locate where they do and so has not focused on giving people the skills required to fill the non-routine occupations that have become increasingly common in an ever-evolving world of work. And policy has not helped places to create the environments that are attractive to higher-skilled firms.
So as cities across the country prepare to deal with the latest wave of change brought about by automation, globalisation and changing demographics, there must be a shift in the policy response on both fronts to this change.
For struggling cities in particular, policy needs to create the conditions that support the development of knowledge, and the use and exchange of it. A key element of this will be to provide their residents with the skills they need to be successful in a labour market that is likely to be ever more dominated by non-routine work.
This should take three main approaches:
Prepare:
Give younger generations entering the labour market the right set of skills and knowledge to succeed in the jobs of the future.
The basis for the estimation for which occupations will become more or less important is founded on the expectation that interpersonal skills, cognitive skills (such as originality and fluency of ideas) and judgment and decision making will become ever more important. This will require teaching both in schools and at further education colleges to adjust to help their students develop such skills.
A major related concern is that schools in a number of areas are failing to provide quality education based on today’s curriculum, even before further improvements to what is taught are considered. Weaker economies such as Hull and Middlesbrough have very few schools deemed as high performing according to the Education Policy Institute,9 meaning pupils in these places face the dual challenge of not being given the core skills required to get a high-skilled job as they enter a labour market where higher-skilled opportunities are limited.
Adjust:
The current workforce should be given adequate resources to adjust to changes in the labour market.
People currently in the labour market need to be able to adapt as the demand for skills changes. This will require continuous training and upskilling.
The unveiling of the National Retraining Scheme in the most recent Industrial Strategy suggests a move in this direction. At this stage the policy applies only to digital and construction jobs, but as such a scheme is rolled out there should be a shift towards developing the idea of lifelong learning. One way to do this would be to allocate each worker a number of hours a year to devote to training, to encourage workers to further their skillset in light of an ever changing labour market. This would require greater funding of the further education sector.
Compensate:
Individuals least able to adapt need to be given adequate compensation for their job loss but should also be given retraining.
As part of any wave of change, not everyone will be better off, at least in the short-term. This means that there will still be a requirement to provide a safety net for people if their job disappears.
But this should be done in conjunction with improved access to and requirement for training, to give individuals the ability to continue to work, as well as helping to shift the skills base of a city to improve its chances of attracting in higher-skilled business investment. Cities and the national government must ensure people who are worse off as a result of future job losses receive adequate support. But unlike the past, this support cannot only come in the form of welfare payments.