


01Where do UK cities export to?
In light of the UK’s decision to exit the EU, trade has become a hot topic. To inform discussions at a national and local level about the UK’s trading arrangements in a post-Brexit world, this chapter sets out estimates of how much our cities exported in 2014, and the destination of those exports.
By setting out the size of their exports and their markets, this analysis shows cities where their challenges and opportunities lie as the UK looks to increase exports in the years ahead. It reviews the extent to which cities depend on individual industries for their exports and what proposed trade deals are likely to mean for them.
For national government, it provides insights about the geographic impact of potential trade deals. It also considers the relationship between exports and productivity at the city level, and the implications this has for both the attempts by the Government to raise productivity, and for its place-based industrial strategy.
Cities and their exports
Cities account for the bulk of Britain’s exports
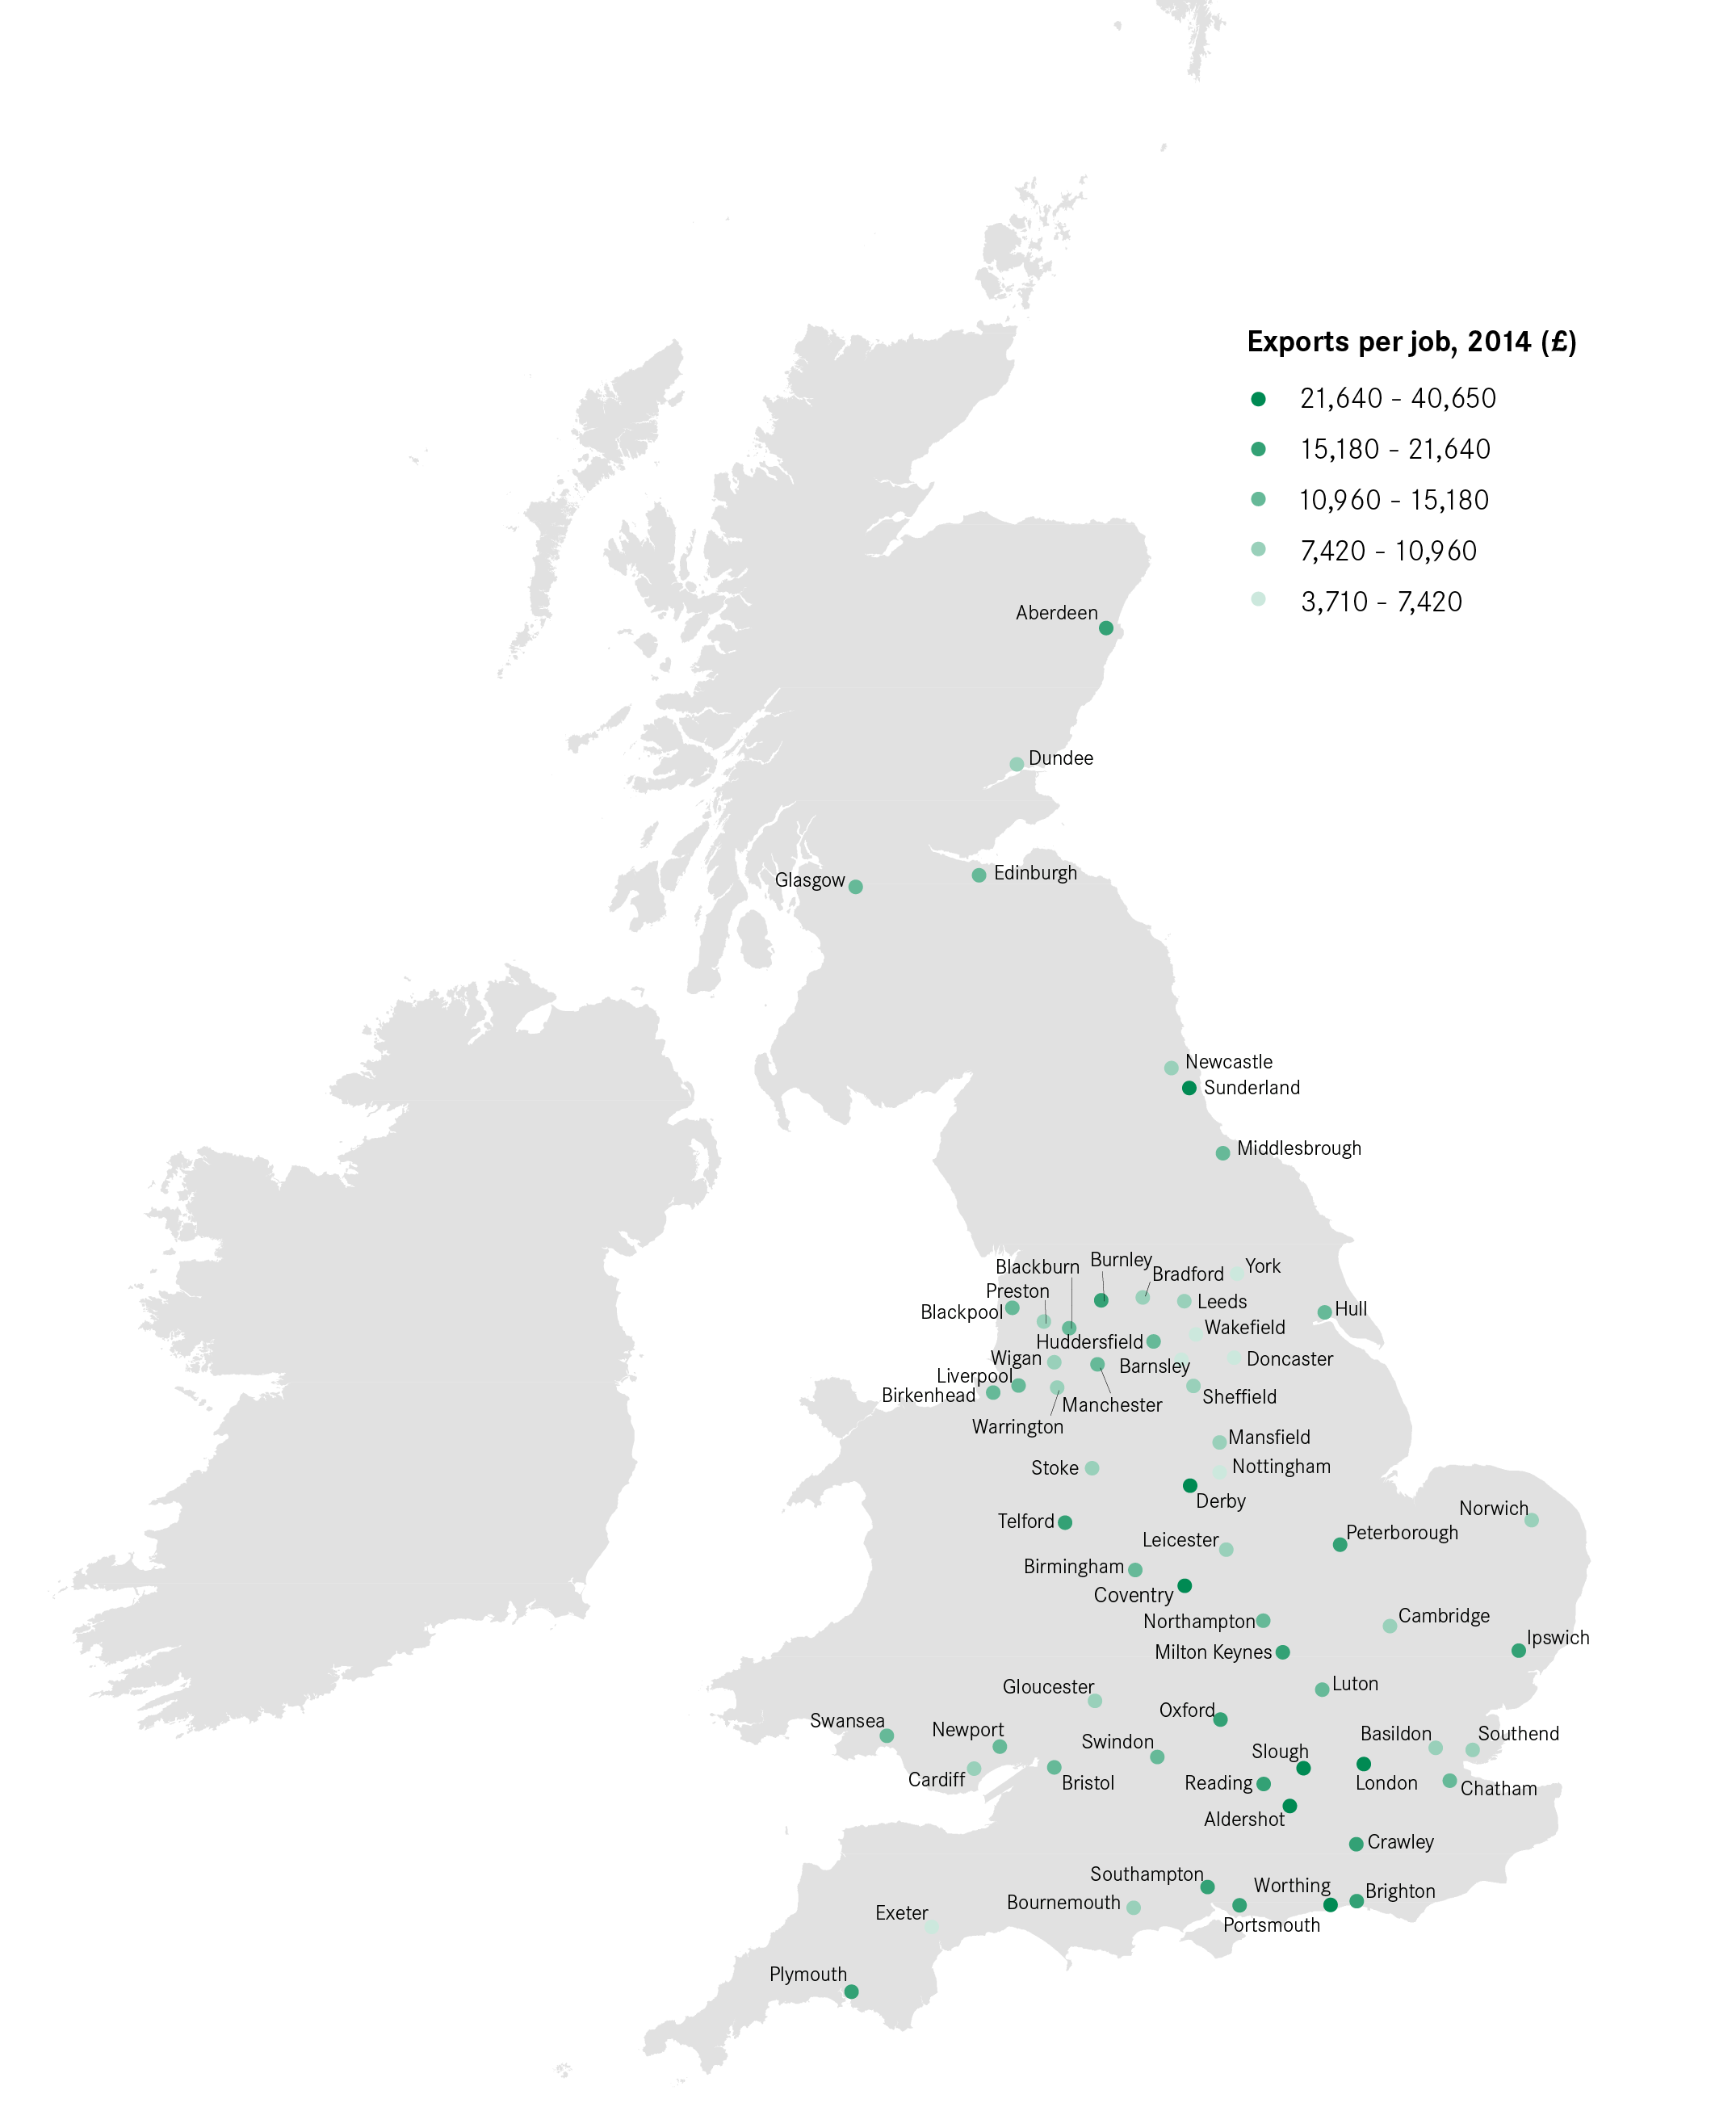
In total, cities accounted for 62 per cent of Britain’s total exports in 2014. The dominance of cities was particularly marked for services – they accounted for 51 per cent of goods exports, but 74 per cent of services exports. In absolute terms, London was the largest contributor, responsible for 28 per cent of all of the nation’s exports to other countries. Yet the picture looks somewhat different when accounting for city size. As Figure 2 shows, Sunderland exported by far the largest amount of goods and services on a per job basis of any British city – it exported one third more than second-placed Worthing.
York, meanwhile, exported the least on this measure. On a per job basis, Sunderland exported 11 times as much as York did in 2014. Four other Yorkshire cities were also in the bottom 10 (Doncaster, Wakefield, Barnsley and Leeds), reflecting Yorkshire’s low exports per job overall.
Figure 2: Total value of exports by city
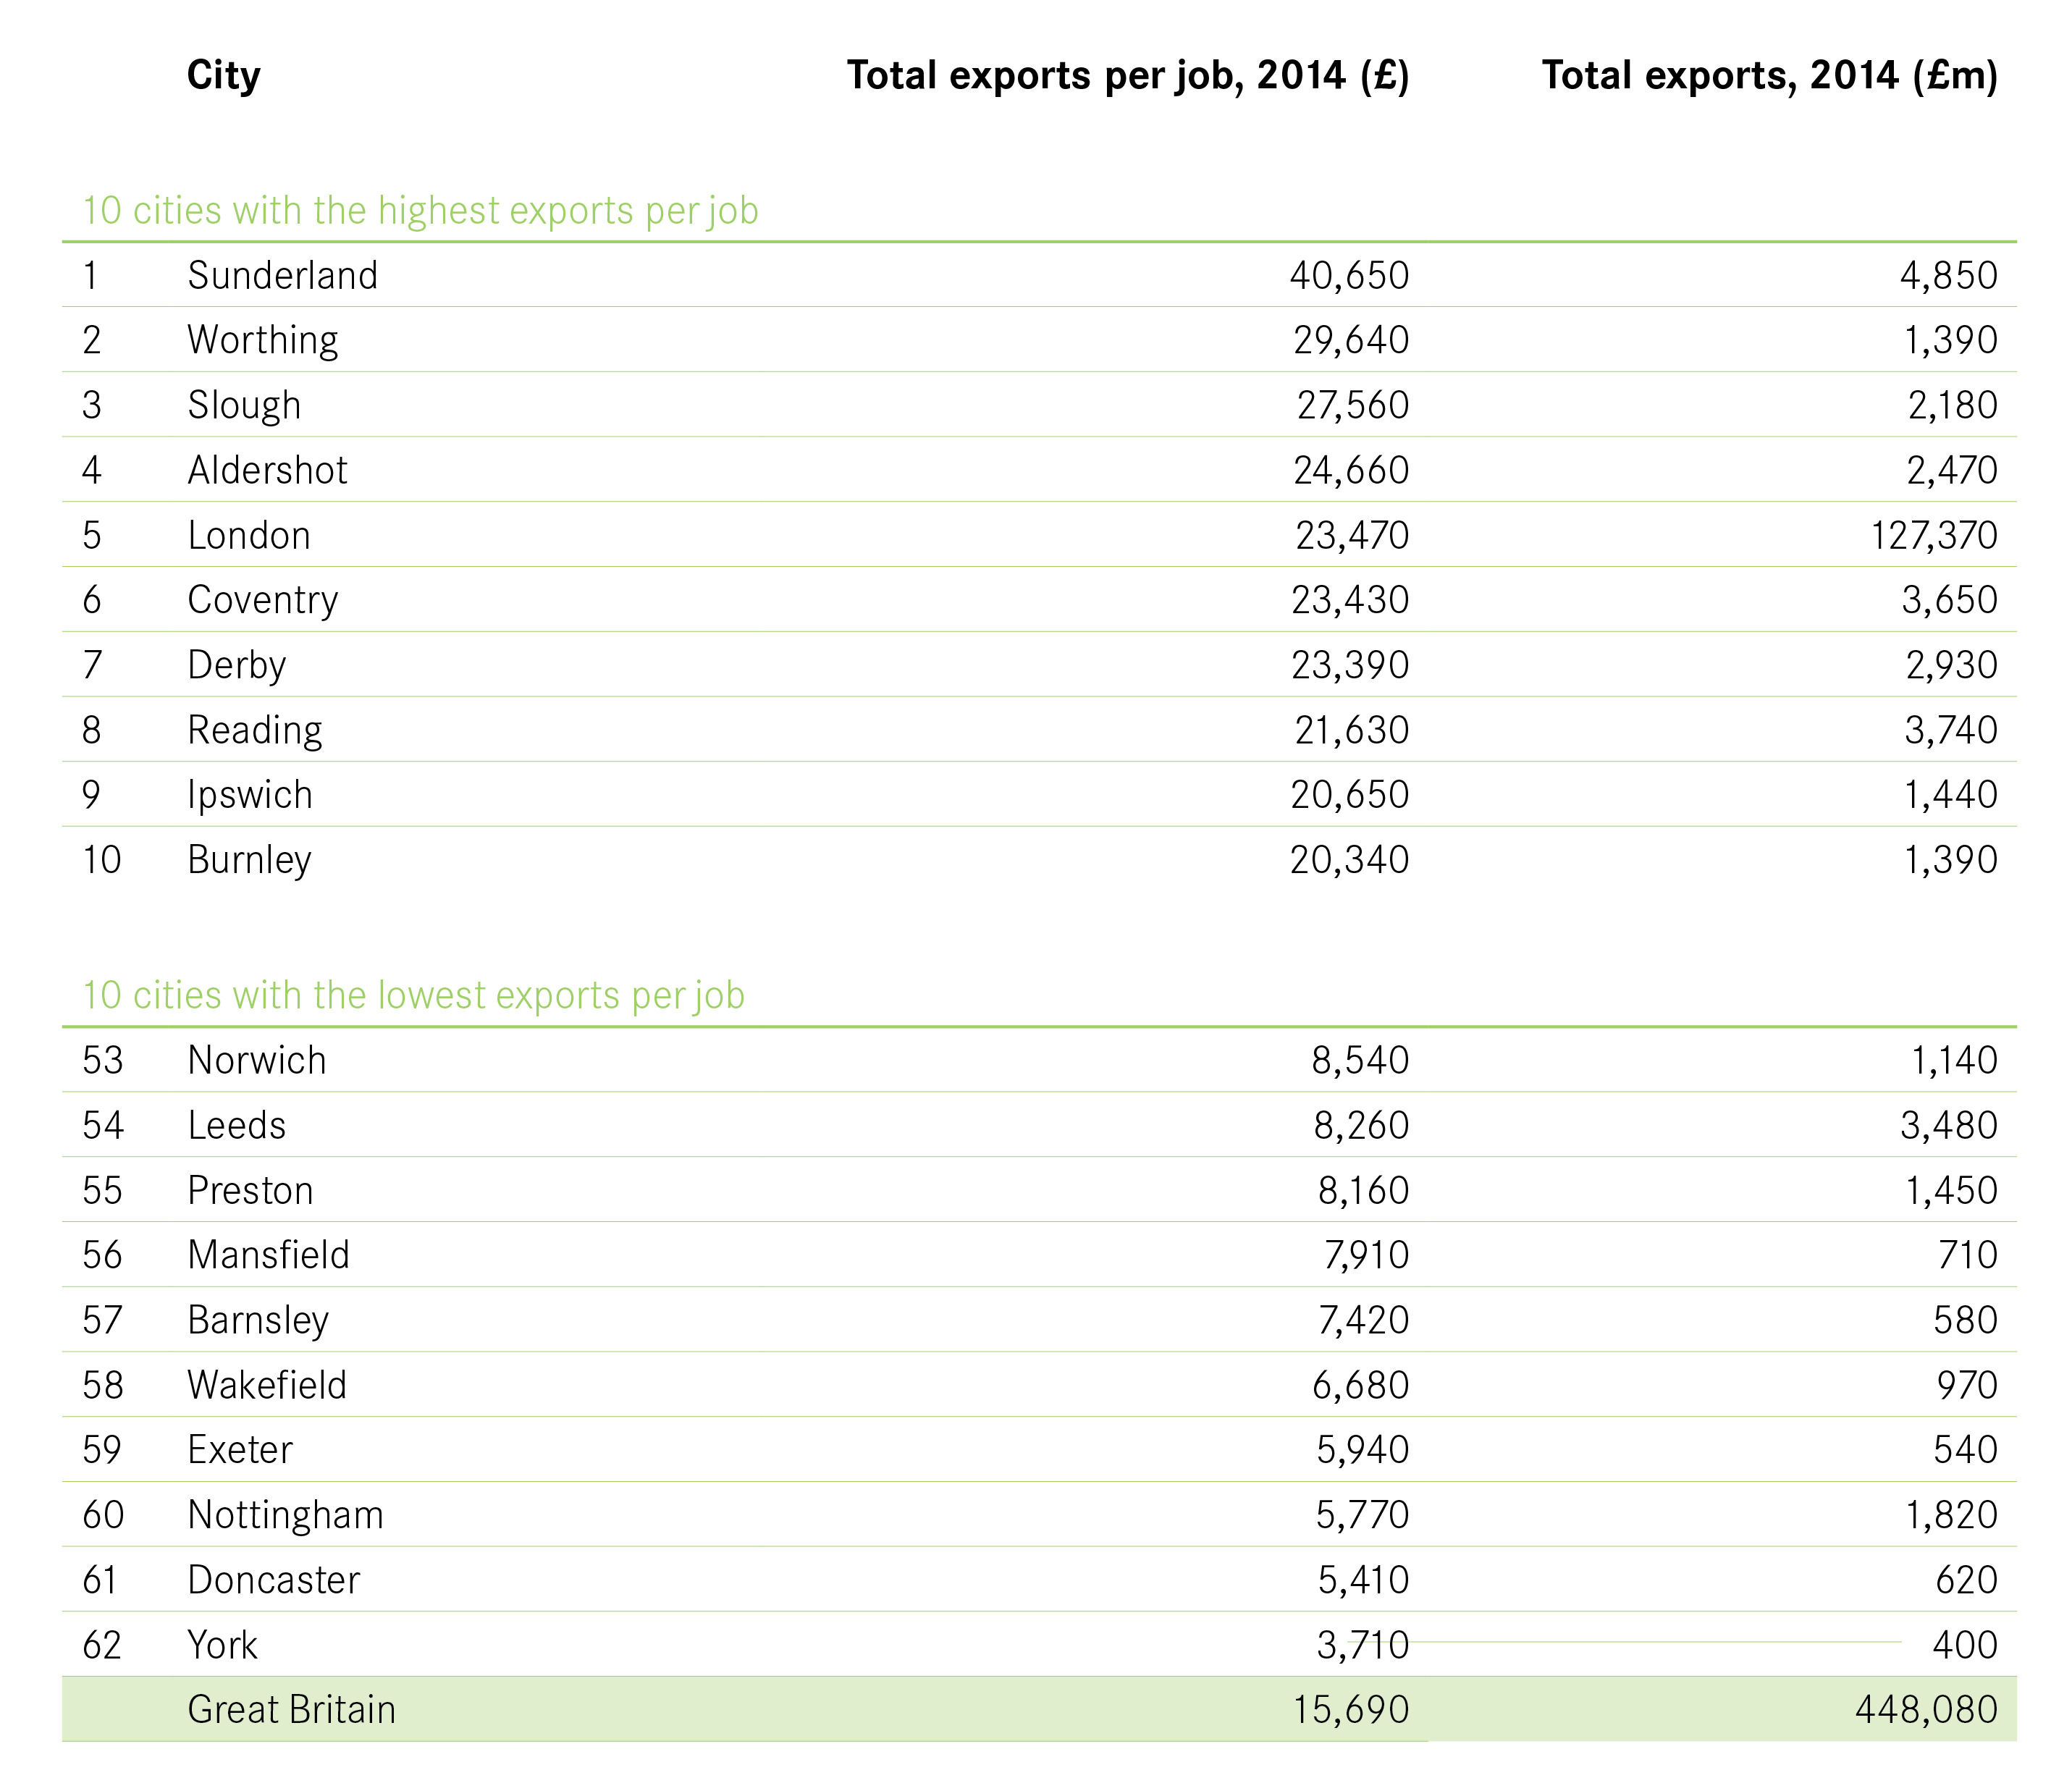
Figure 3: Exports per job
Services exports play a larger role in southern cities
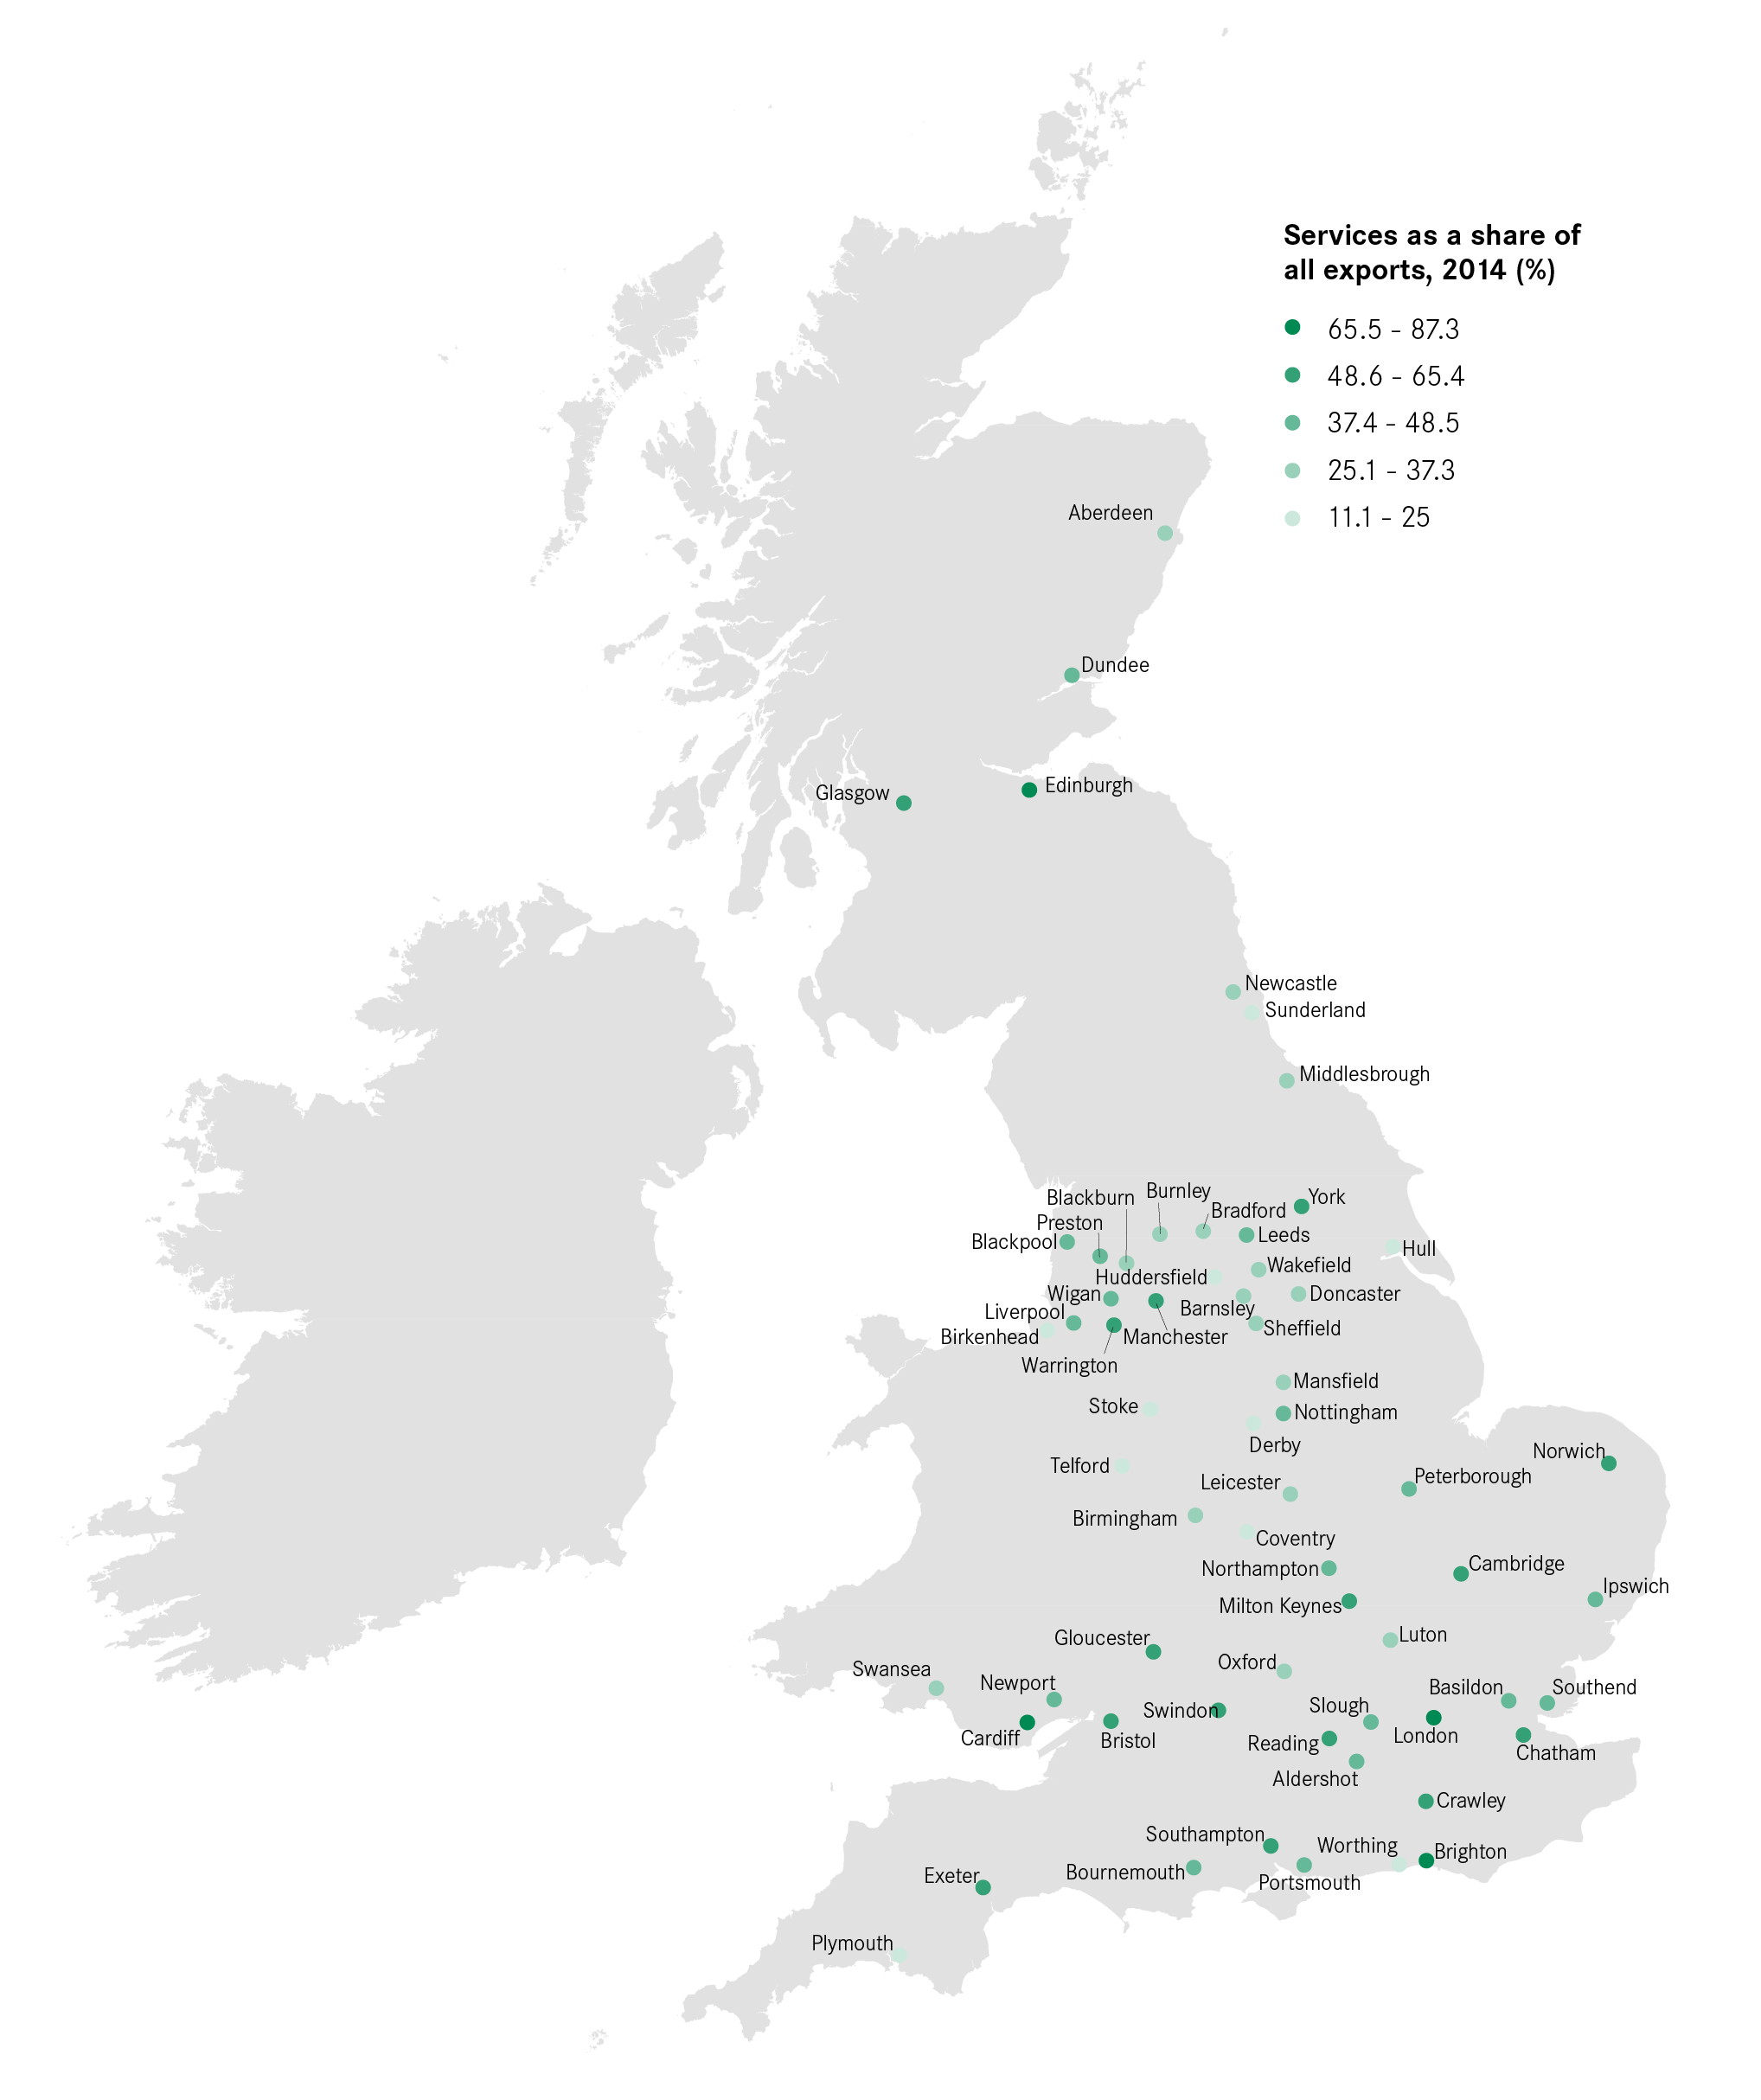
The contribution of goods and services to total exports varied across cities. Goods exports tended to dominate in cities in the North and Midlands (see Figure 5). This was greatest in Derby and Hull, where nearly 90 per cent of exports from these two cities were goods. Meanwhile southern cities tended to have a much greater reliance on services. The exception was Edinburgh – the city most reliant on services exports – where 87 per cent of exports were services. Box 2 looks at the top services-exporting cities.
Box 2: Top services-exporting cities
Services exports per job (i.e. the total amount of services sold abroad relative to all jobs in a city) tended to be much higher in southern cities than elsewhere in Britain. At just under £18,000 for every job in the city, London had the highest output. Edinburgh was the only city outside the South to appear in the top 10 (see Figure 4). Hull had the lowest services output per job, with all of the bottom 10 cities being in the North or Midlands.
Figure 4: Services exports per job
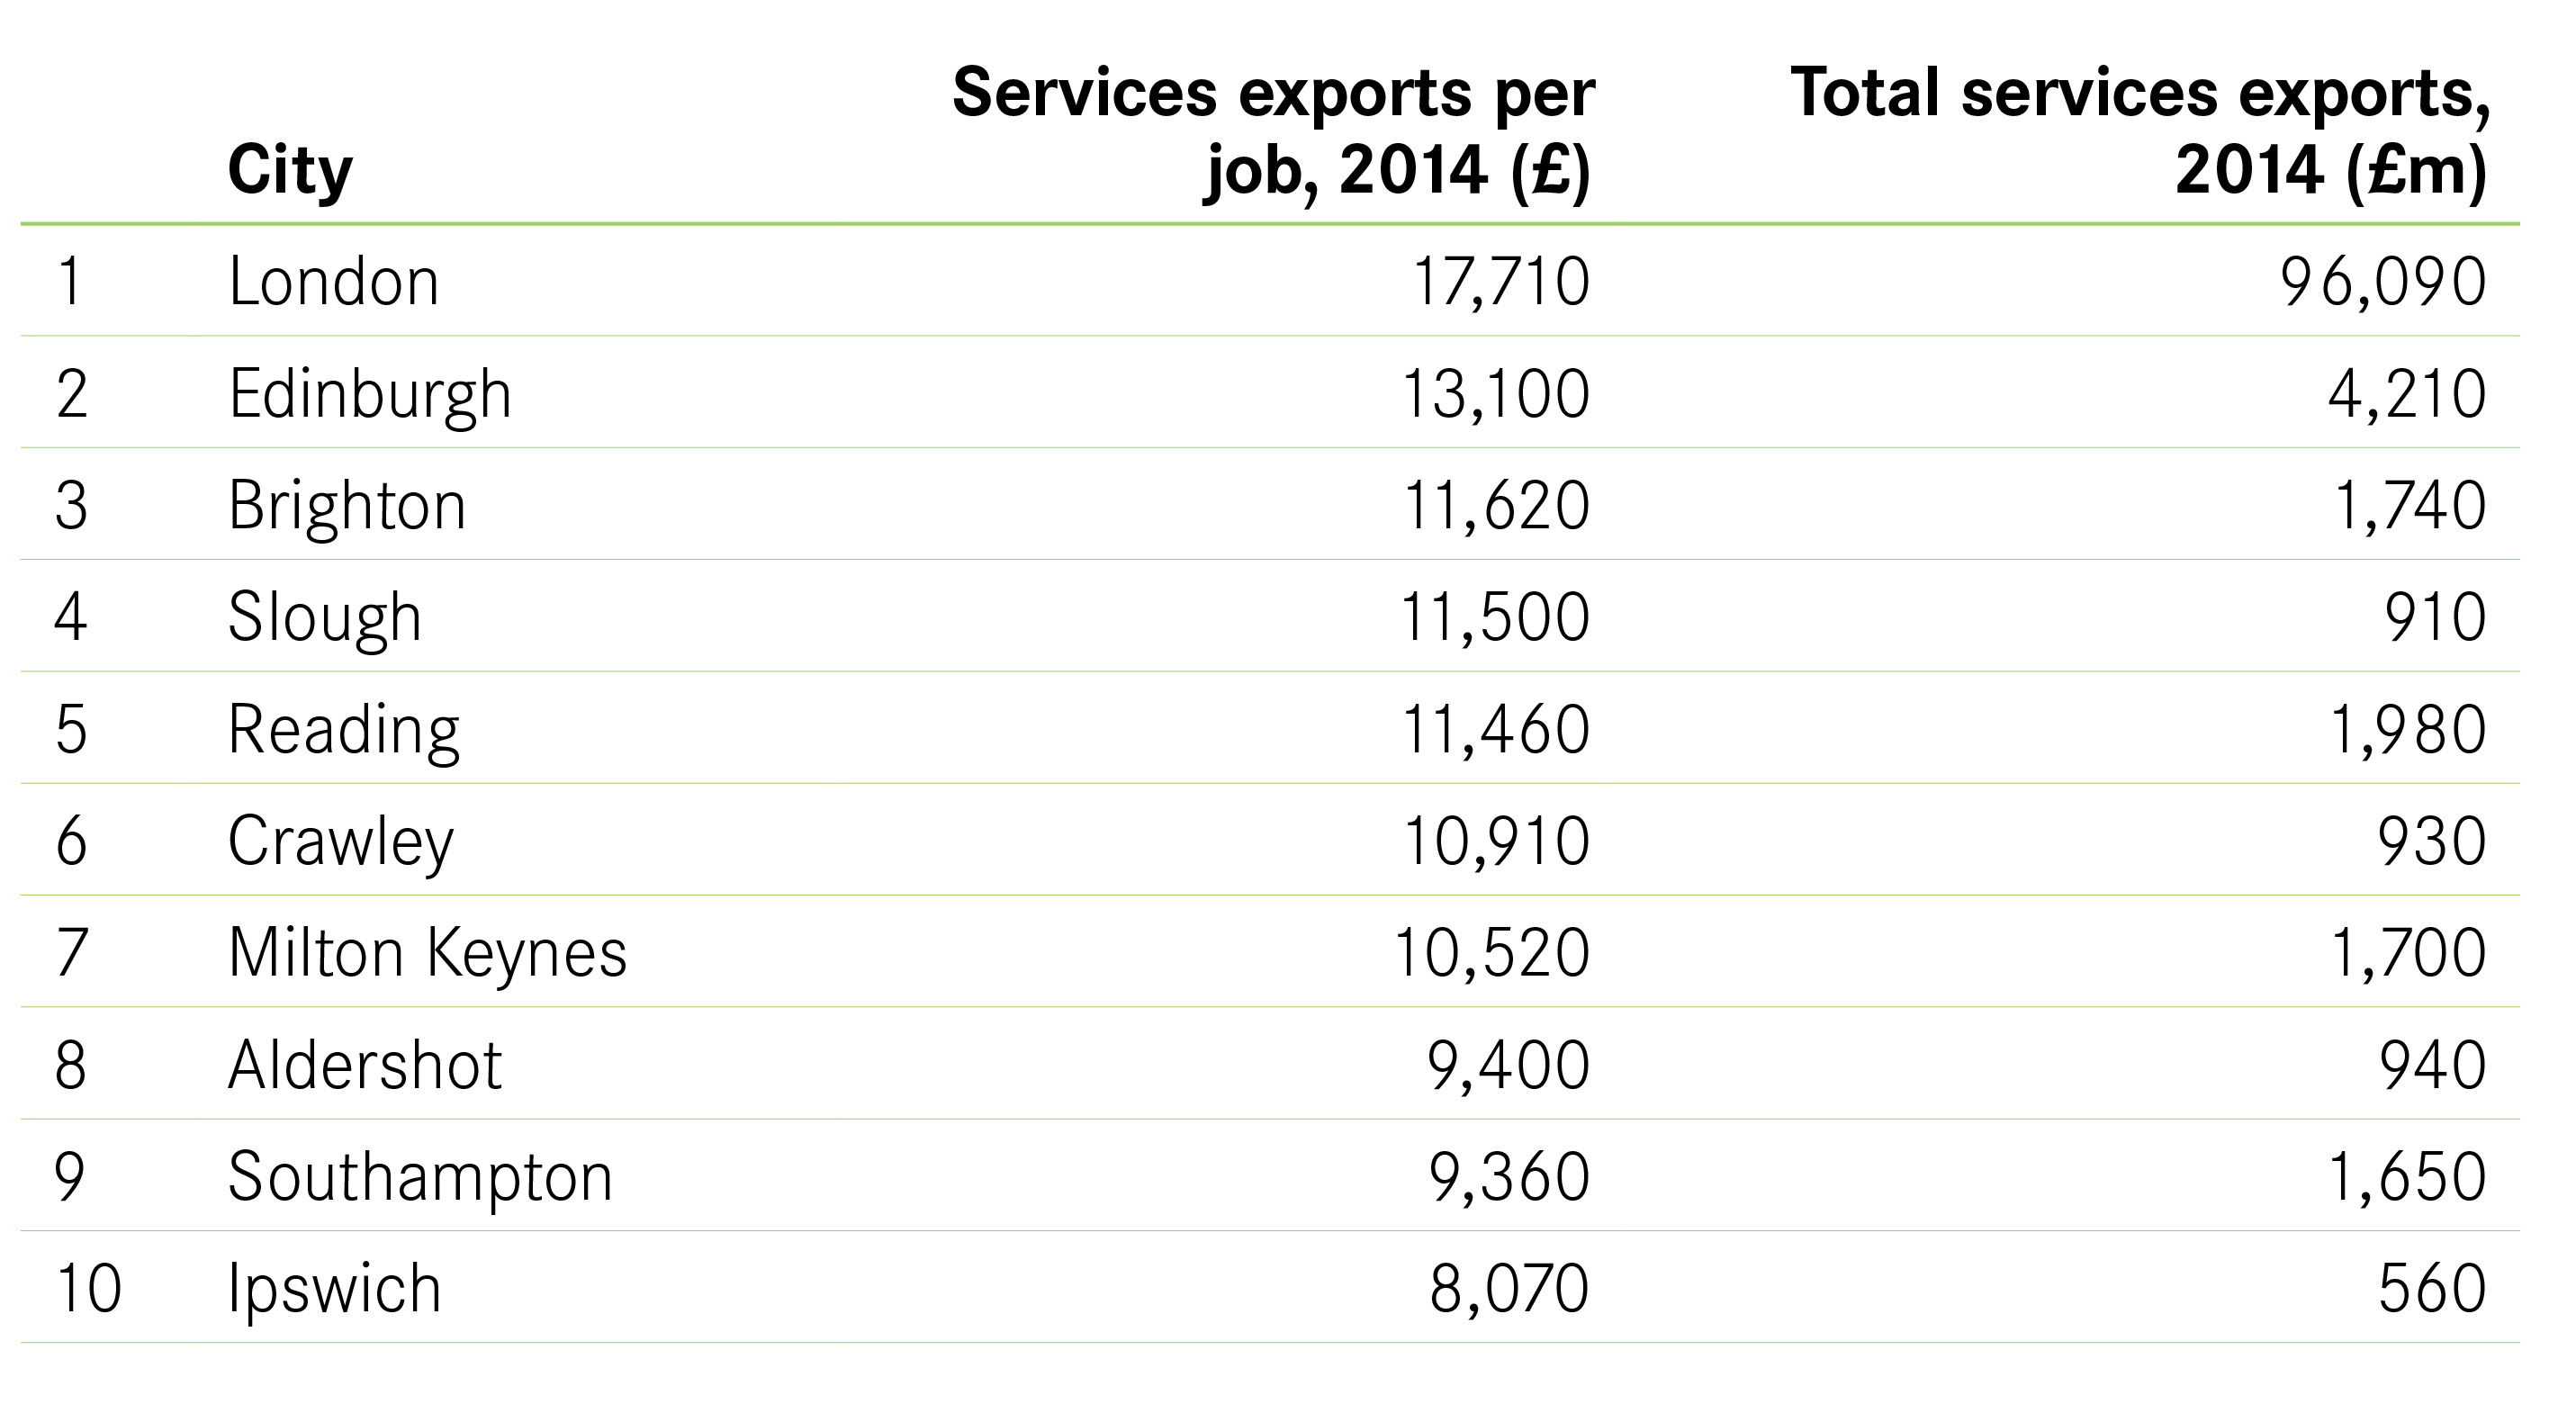
Figure 5: Services as a share of all exports
In some cities single industries account for the majority of exports
For most cities, their exports are generated by a range of industries. In total 35 cities had less than one-fifth of their exports concentrated in one industry. Portsmouth was the city that had the most diversified export base, with its top exporting industry – information and communications – accounting for just 9 per cent of exports.
Figure 6: The largest single sector contributor to total exports
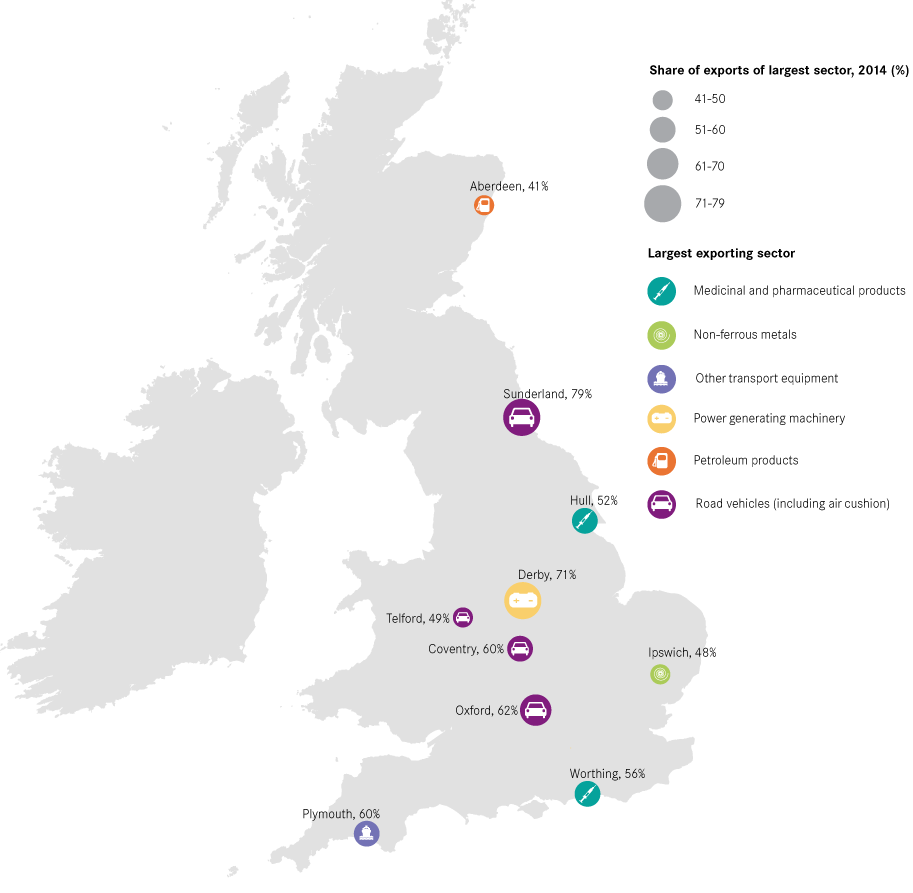
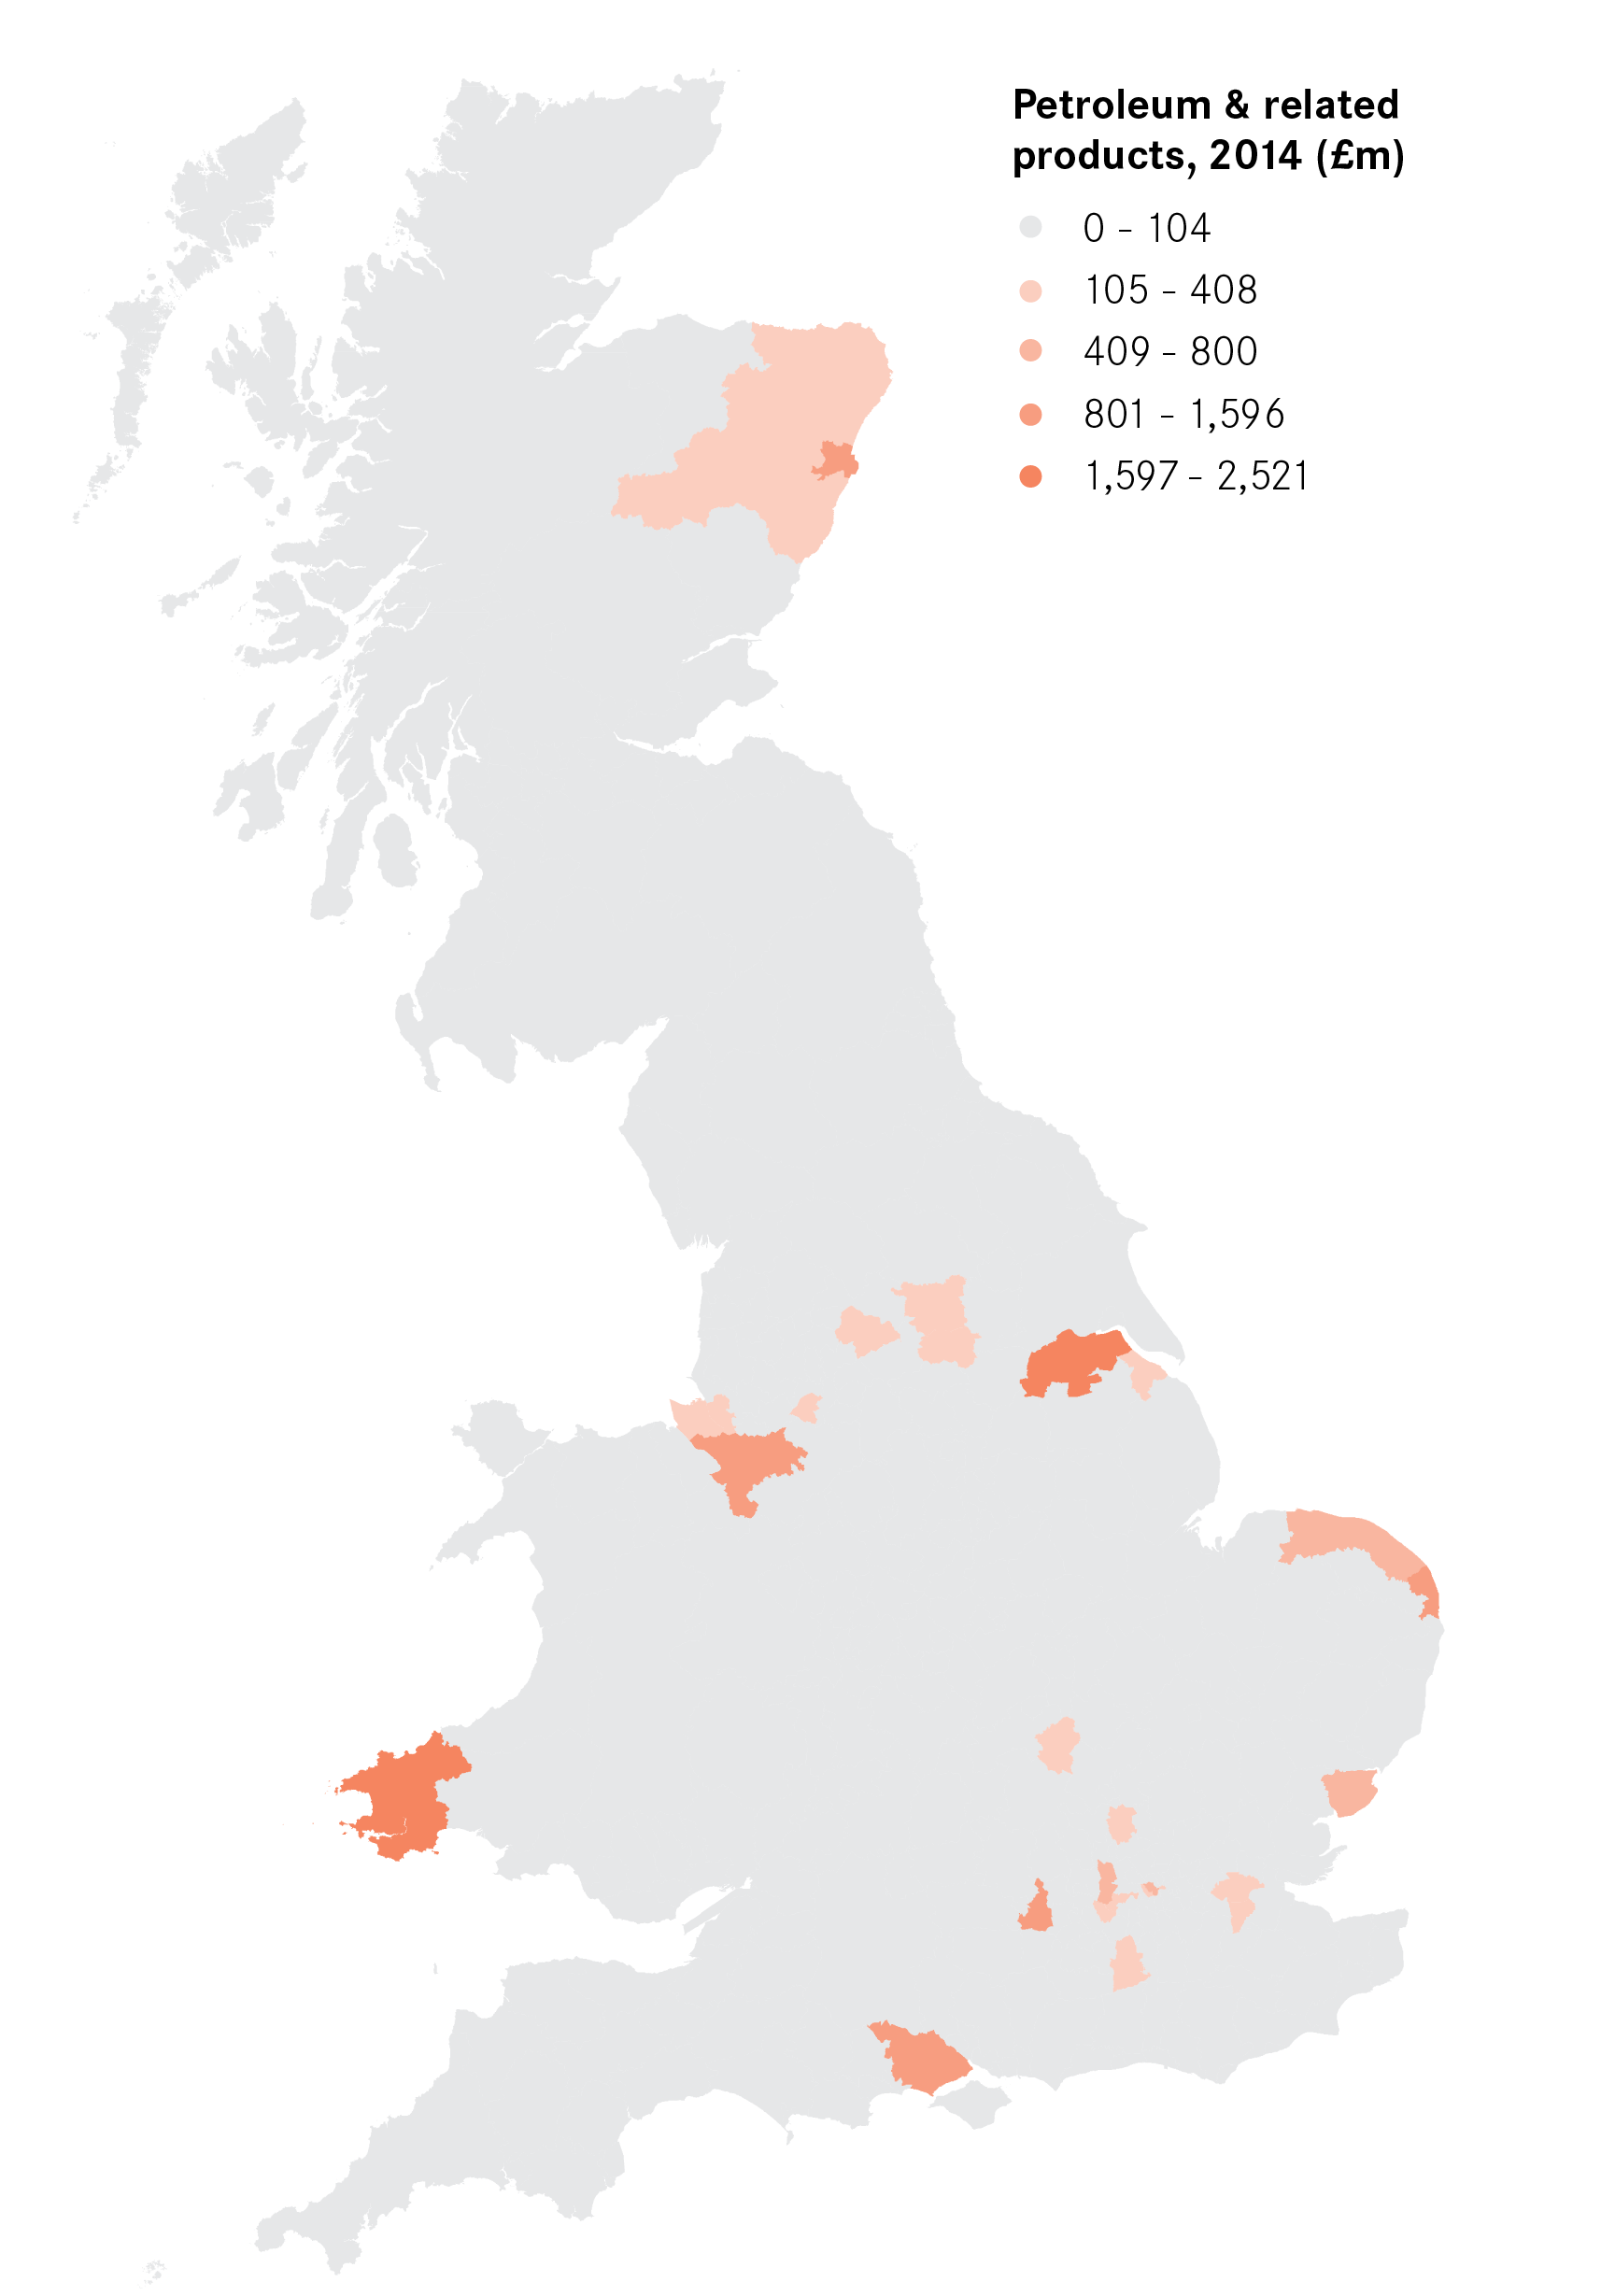
Figure 7: The location of exports from selected industries


But as Figure 6 shows, a handful of cities are heavily reliant on one industry for their exports, which leaves their export base particularly vulnerable to changes in either demand for that product or a change in any trade agreements. Sunderland leads this list. Its impressive export performance was driven by car making, which accounted for four-fifths of all of the city’s exports. Without auto manufacture, Sunderland would have had the 12th lowest exports per job of all cities, rather than the highest.
Sunderland is not alone on this measure. Seven cities relied on one single industry to produce over half of their exports. In Derby, an estimated 71 per cent of exports were a result of power generating machinery and equipment (led by Rolls Royce), and Oxford’s car industry accounted for 62 per cent of its exports.
The dominance of some industries in particular cities reflects their concentration in particular places. Figure 7 shows the geography of chemicals, petroleum, pharmaceuticals and road vehicles exports. As can be seen, they were produced in a very small number of places across Britain.
The EU is the largest market for almost all cities
Of course, knowing where these exports are sold to is also vital, particularly as the UK’s trading relationship with the EU changes, alongside its ambitions to grow relationships with emerging markets such as China and India.
Figure 8: Selected destinations of exports from British cities
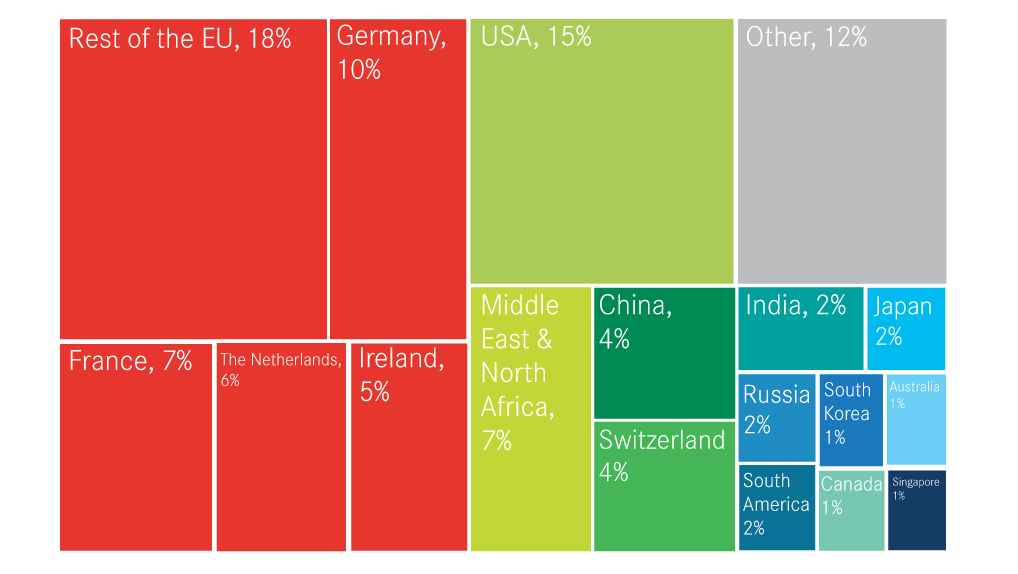
The EU is by far the biggest destination for exports from British cities. Figure 8 shows that EU countries accounted for 46 per cent of Britain’s urban exports – three times more than the USA. China was the third largest single-market buyer, but at 4 per cent this was considerably smaller than the EU or the USA, and on a par with Switzerland.
The importance of the EU as the primary market for exports holds across most cities. In 37 of Britain’s 62 cities, more than half of exports headed to the EU (see Figure 9). The EU was the largest export market for every city in Britain with the exception of Hull.
Figure 9: Share of exports to the EU
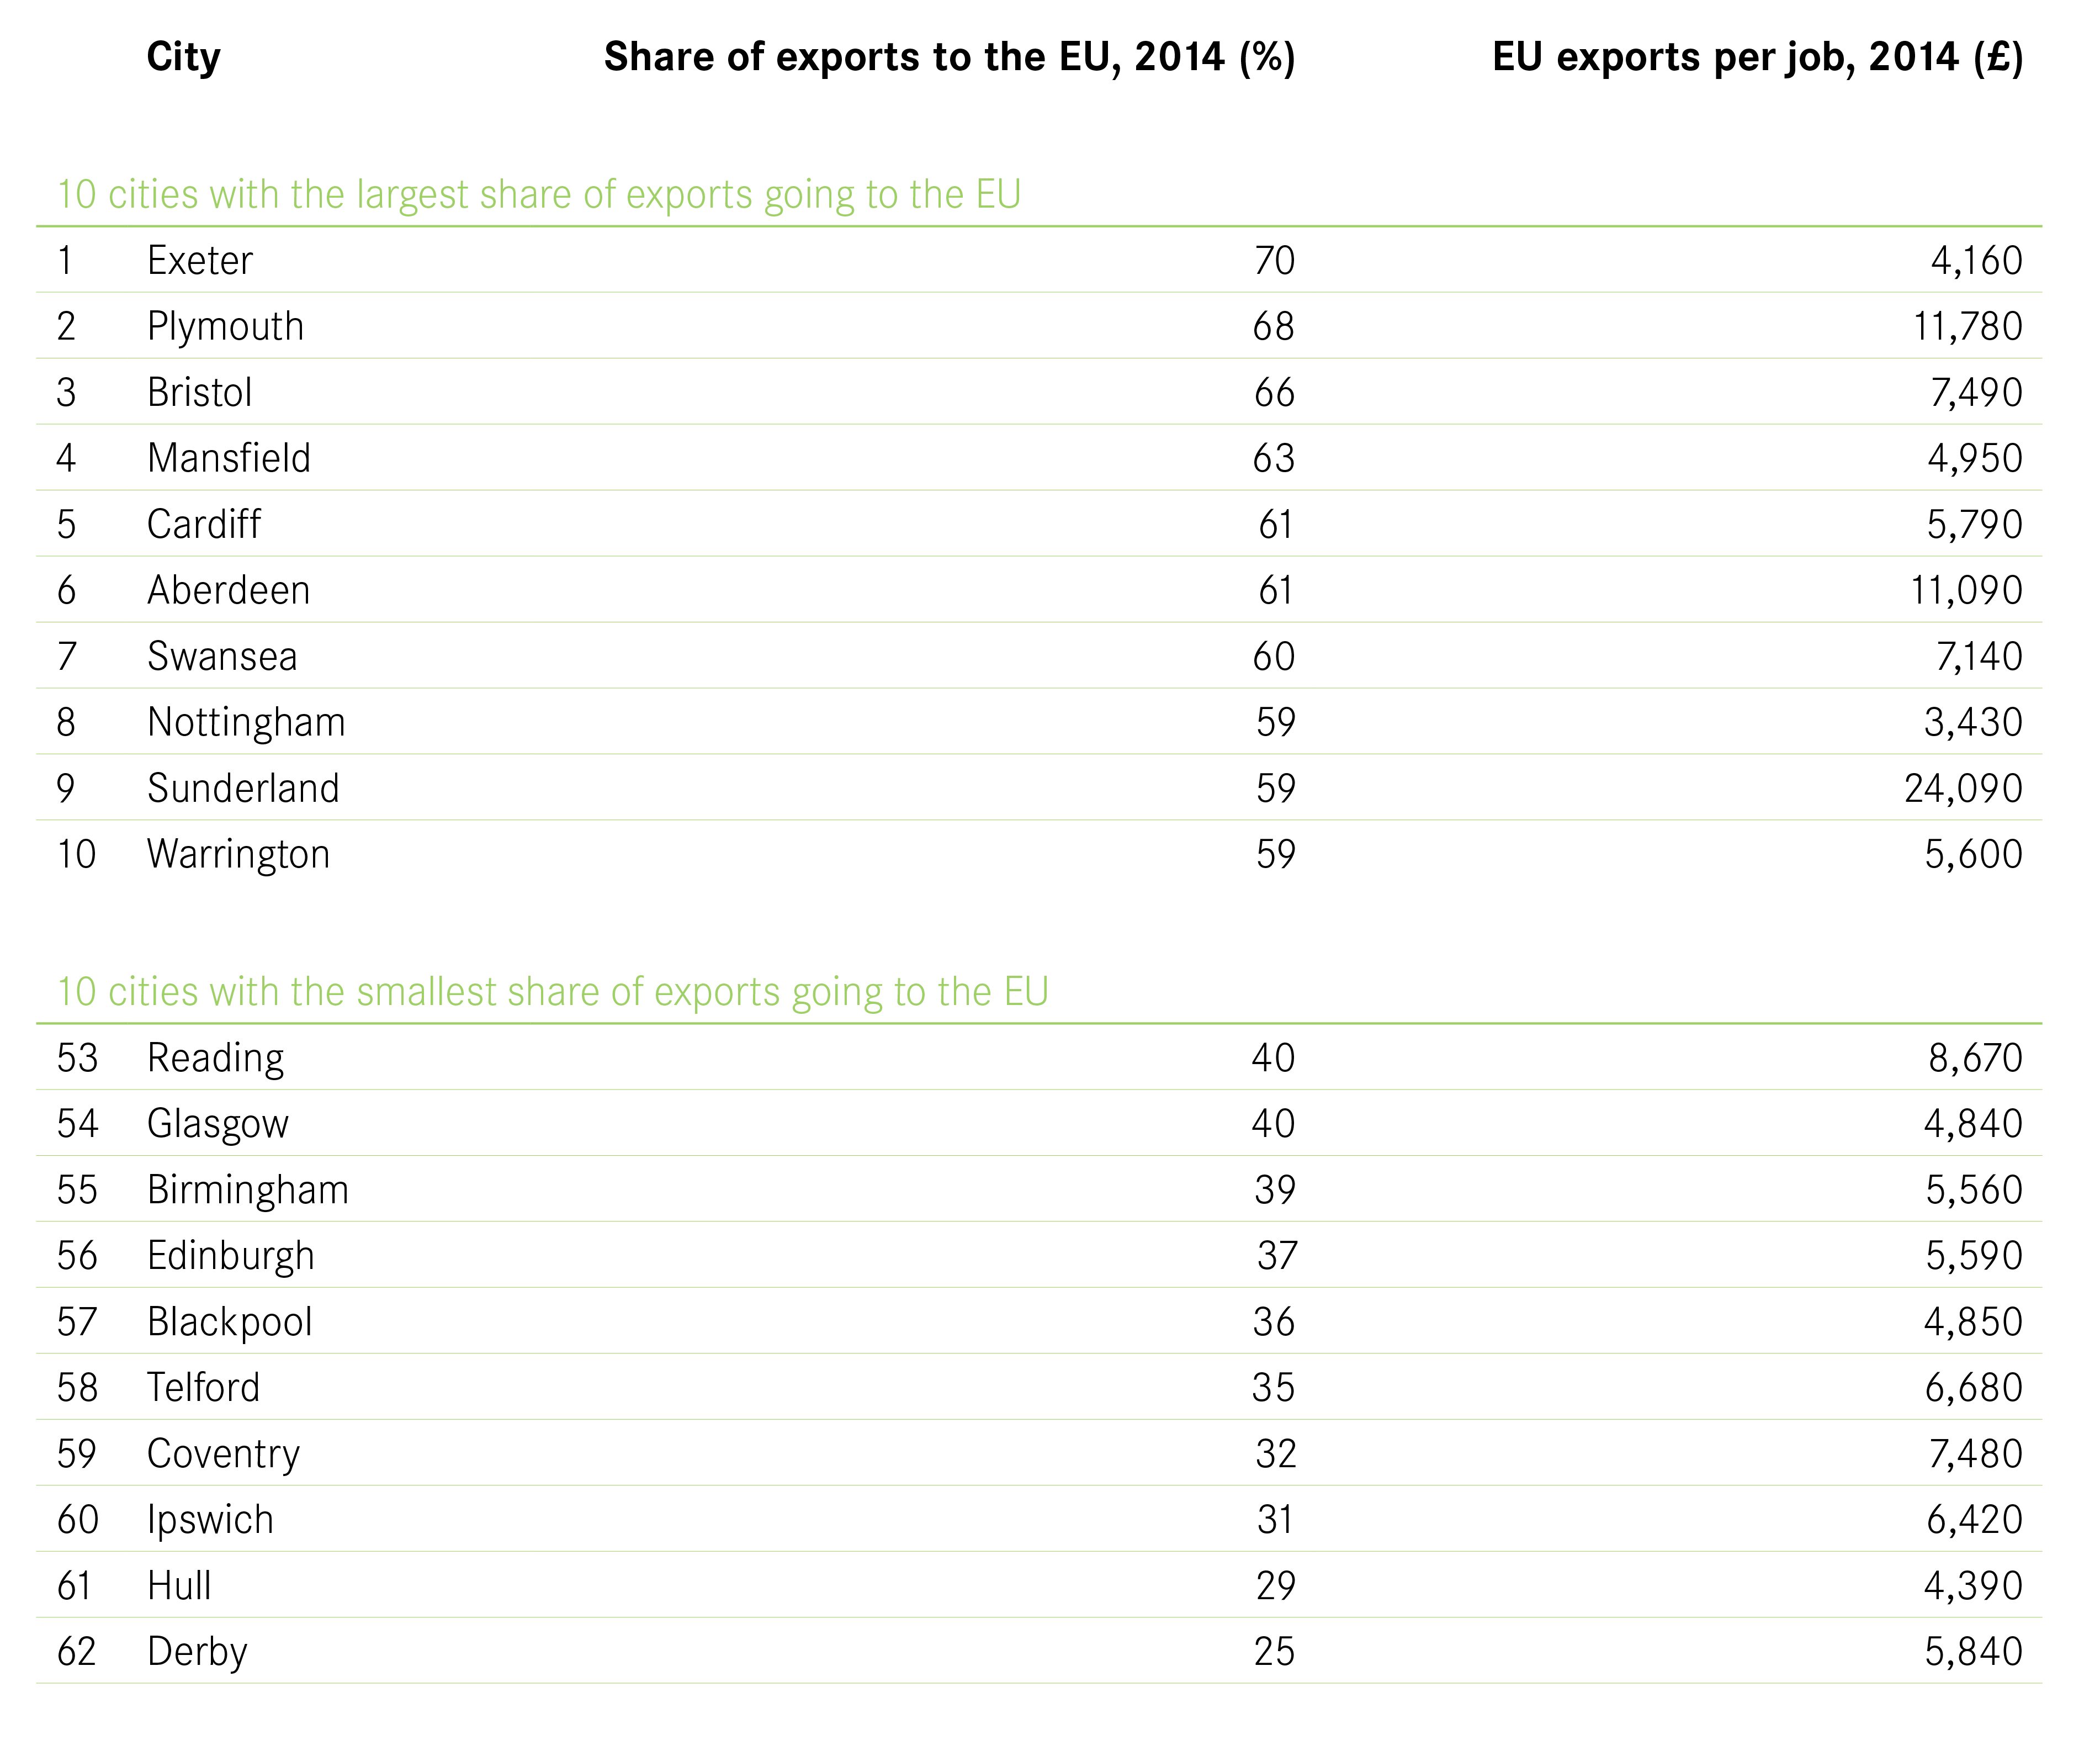
Exeter’s exports were the most dependent on the EU, with 70 per cent of all of its exports going to EU countries (led by Germany and France, which received half of all of the city’s exports). It was followed by Plymouth and Bristol.
Derby, on the other hand, was least dependent, with just 25 per cent of its exports going to EU countries. North America was instead a much more important source of custom for Derby than in other cities. Exports to the USA accounted for 22 per cent of all of the city’s exports, with Canada accounting for a further 4 per cent (the highest of any city). Singapore was also an important market, accounting for £1 in every £10 spent on Derby’s exports.
Figure 10: Dependence on foreign markets
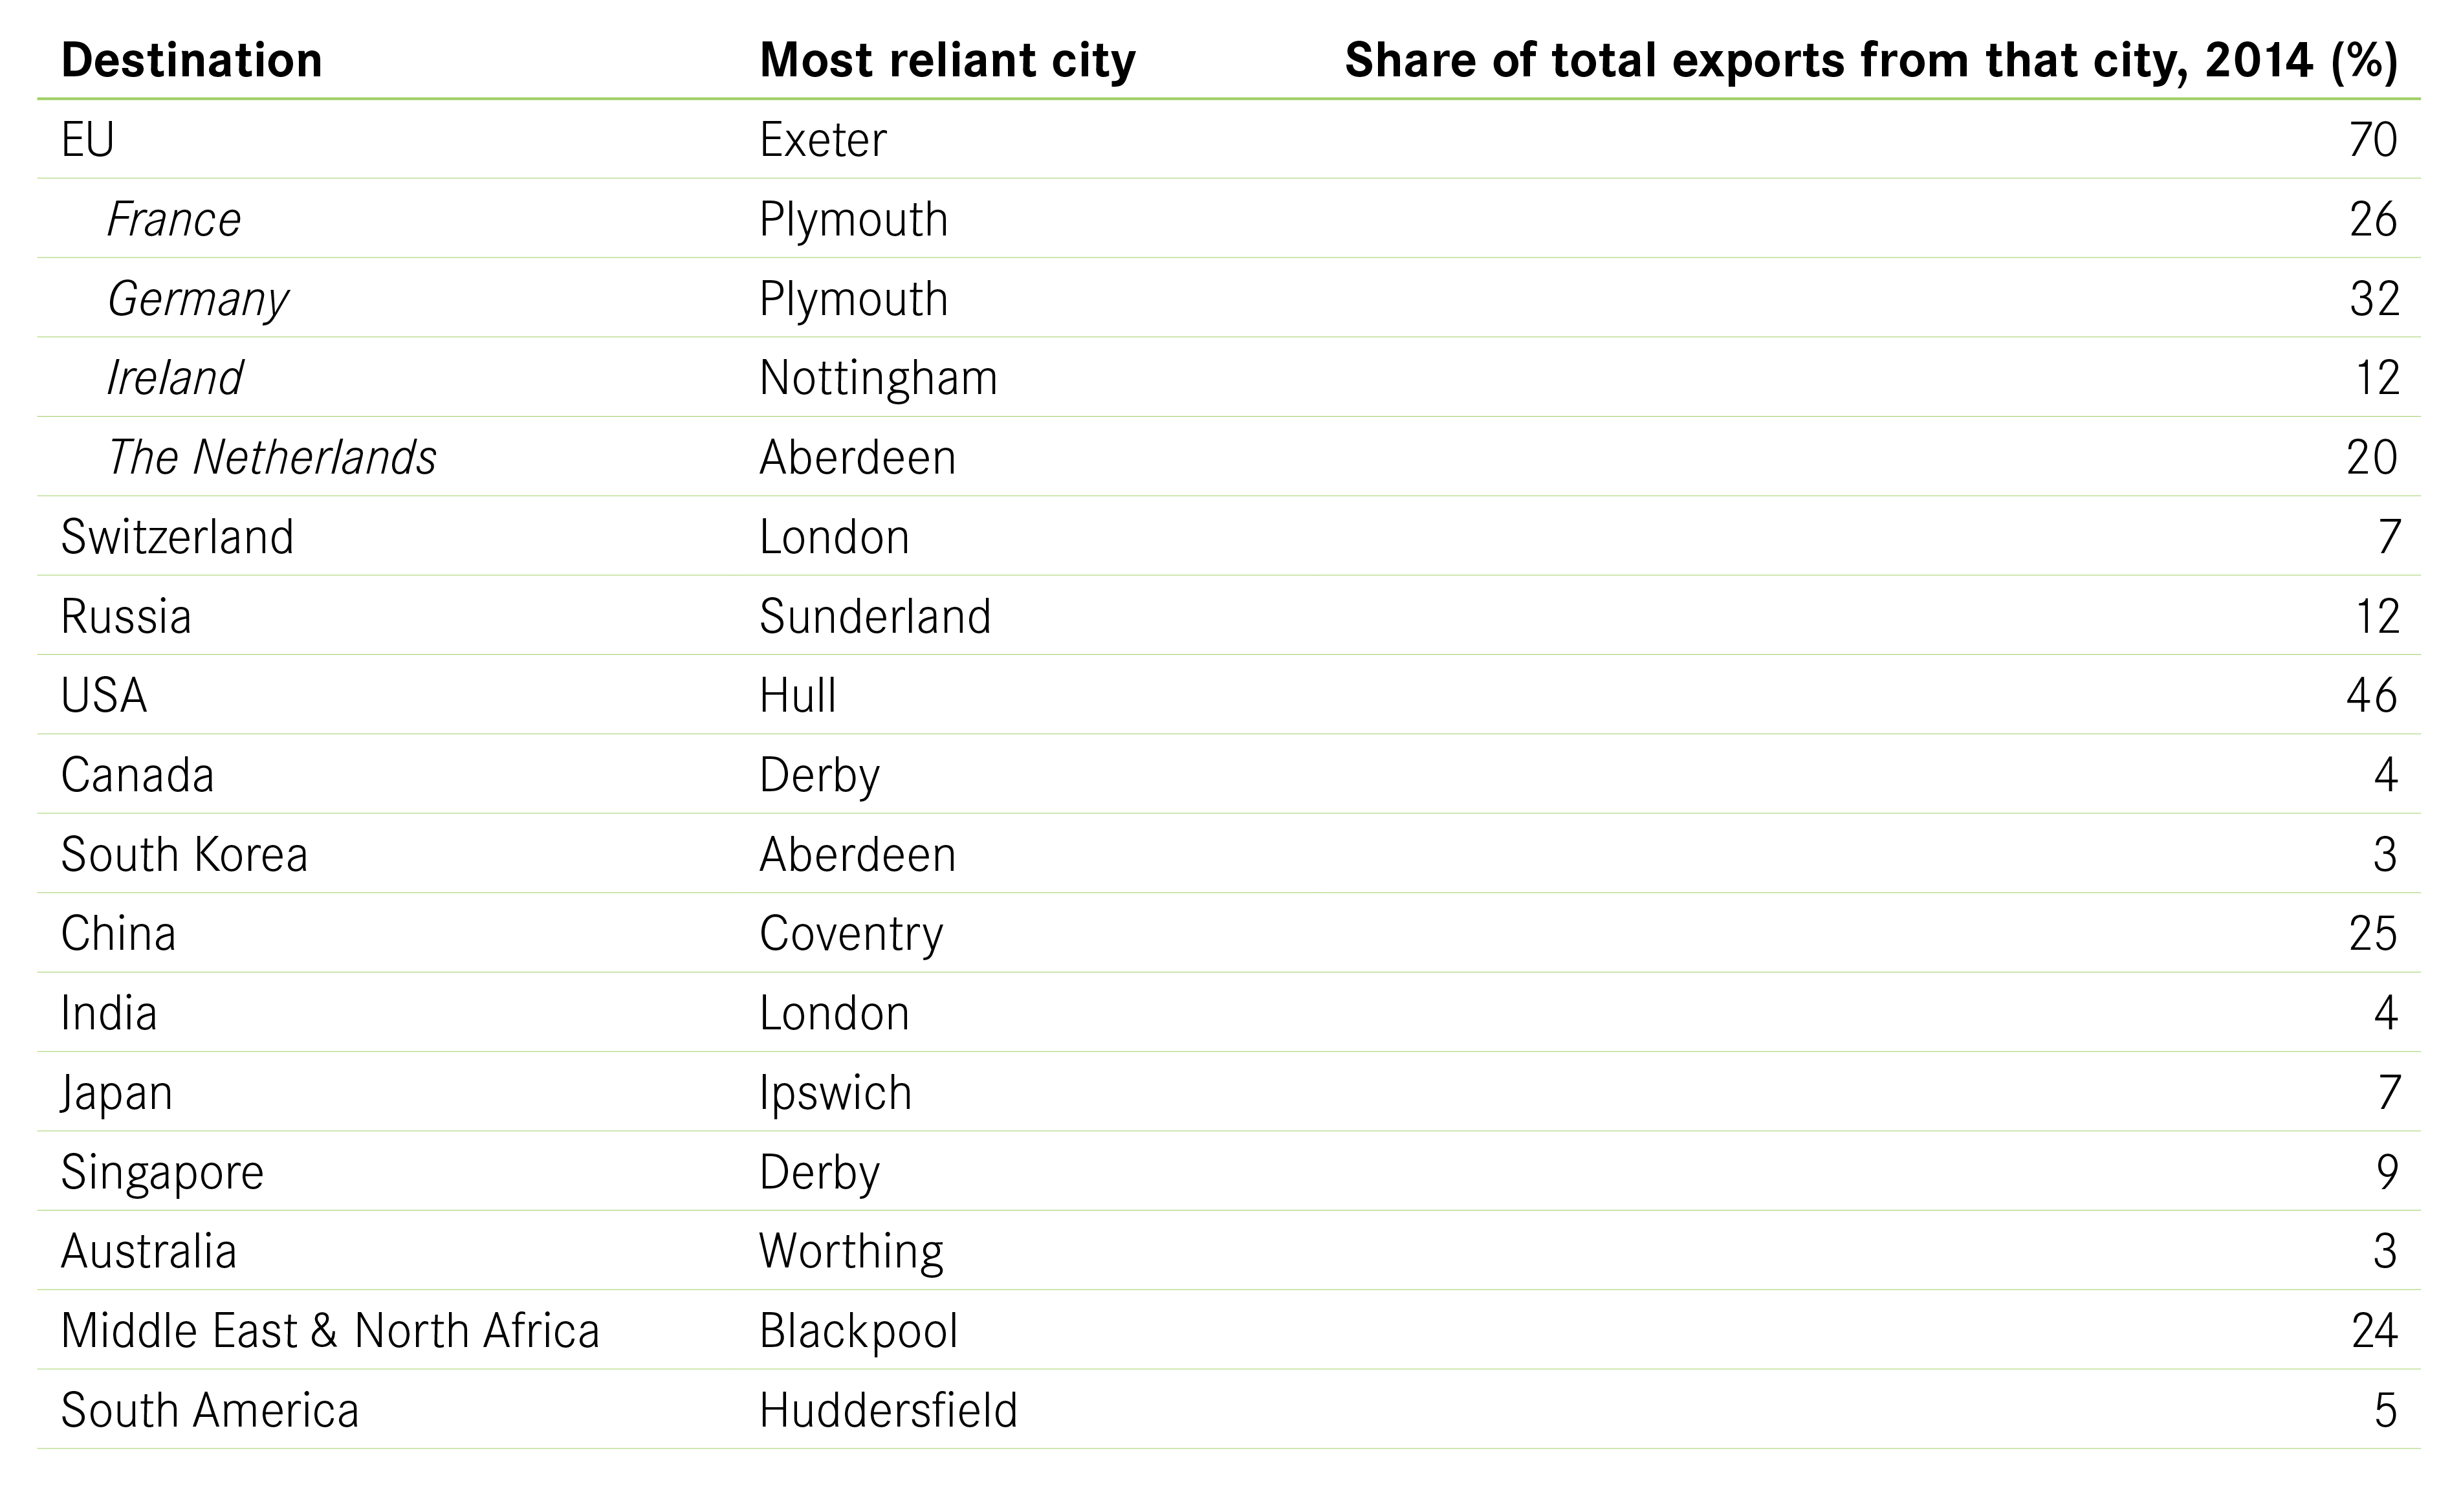
The USA bought the largest share of Hull’s exports, with almost half of the city’s goods and services heading across the Atlantic. This made Hull by far the most reliant on the USA of all British cities, as shown in Figure 10.
Figure 10 also shows that:
- Coventry was the city most reliant on China, with a quarter of all of its exports heading there (almost exclusively road vehicles).
- Blackpool was most dependent on markets in the Middle East and North Africa.
- 12 per cent of exports from Sunderland went to Russia, higher than anyother city. Again, this was almost exclusively cars.
How exports relate to wider economic performance
The UK needs to increase its exports to improve its productivity
Exports matter because exporters tend to be the drivers of productivity growth as a result of their greater ability to generate and absorb new innovations. To take an extreme example for illustrative purposes: while a barber is unlikely to be much more productive than he or she would have been 50 years ago (the time to cut a head of hair is unlikely to have reduced a great deal over that period), someone working in a car factory is now many times more productive than half a century earlier, and computers have vastly increased the value of work that someone working in cinema special effects, for example, can do in a day.
This can be seen in the productivity growth of different sectors in the UK. Since 1990, productivity has more than doubled in the manufacture of computer and electrical equipment and information and communications, and has almost tripled in chemicals and pharmaceuticals. But very little growth has been seen in a number of sectors that tend to sell to local markets only. For example, productivity increased by just 0.7 per cent in food and accommodation, and has declined in real estate.1
Given the ongoing policy imperative to increase the productivity of the UK economy, encouraging the growth of exporting firms will be important. And understanding how this plays out across the country will also be important in helping the Government support economic growth everywhere.
But at a city level, having high exports does not automatically mean it is a more productive place – the type of exports matters too
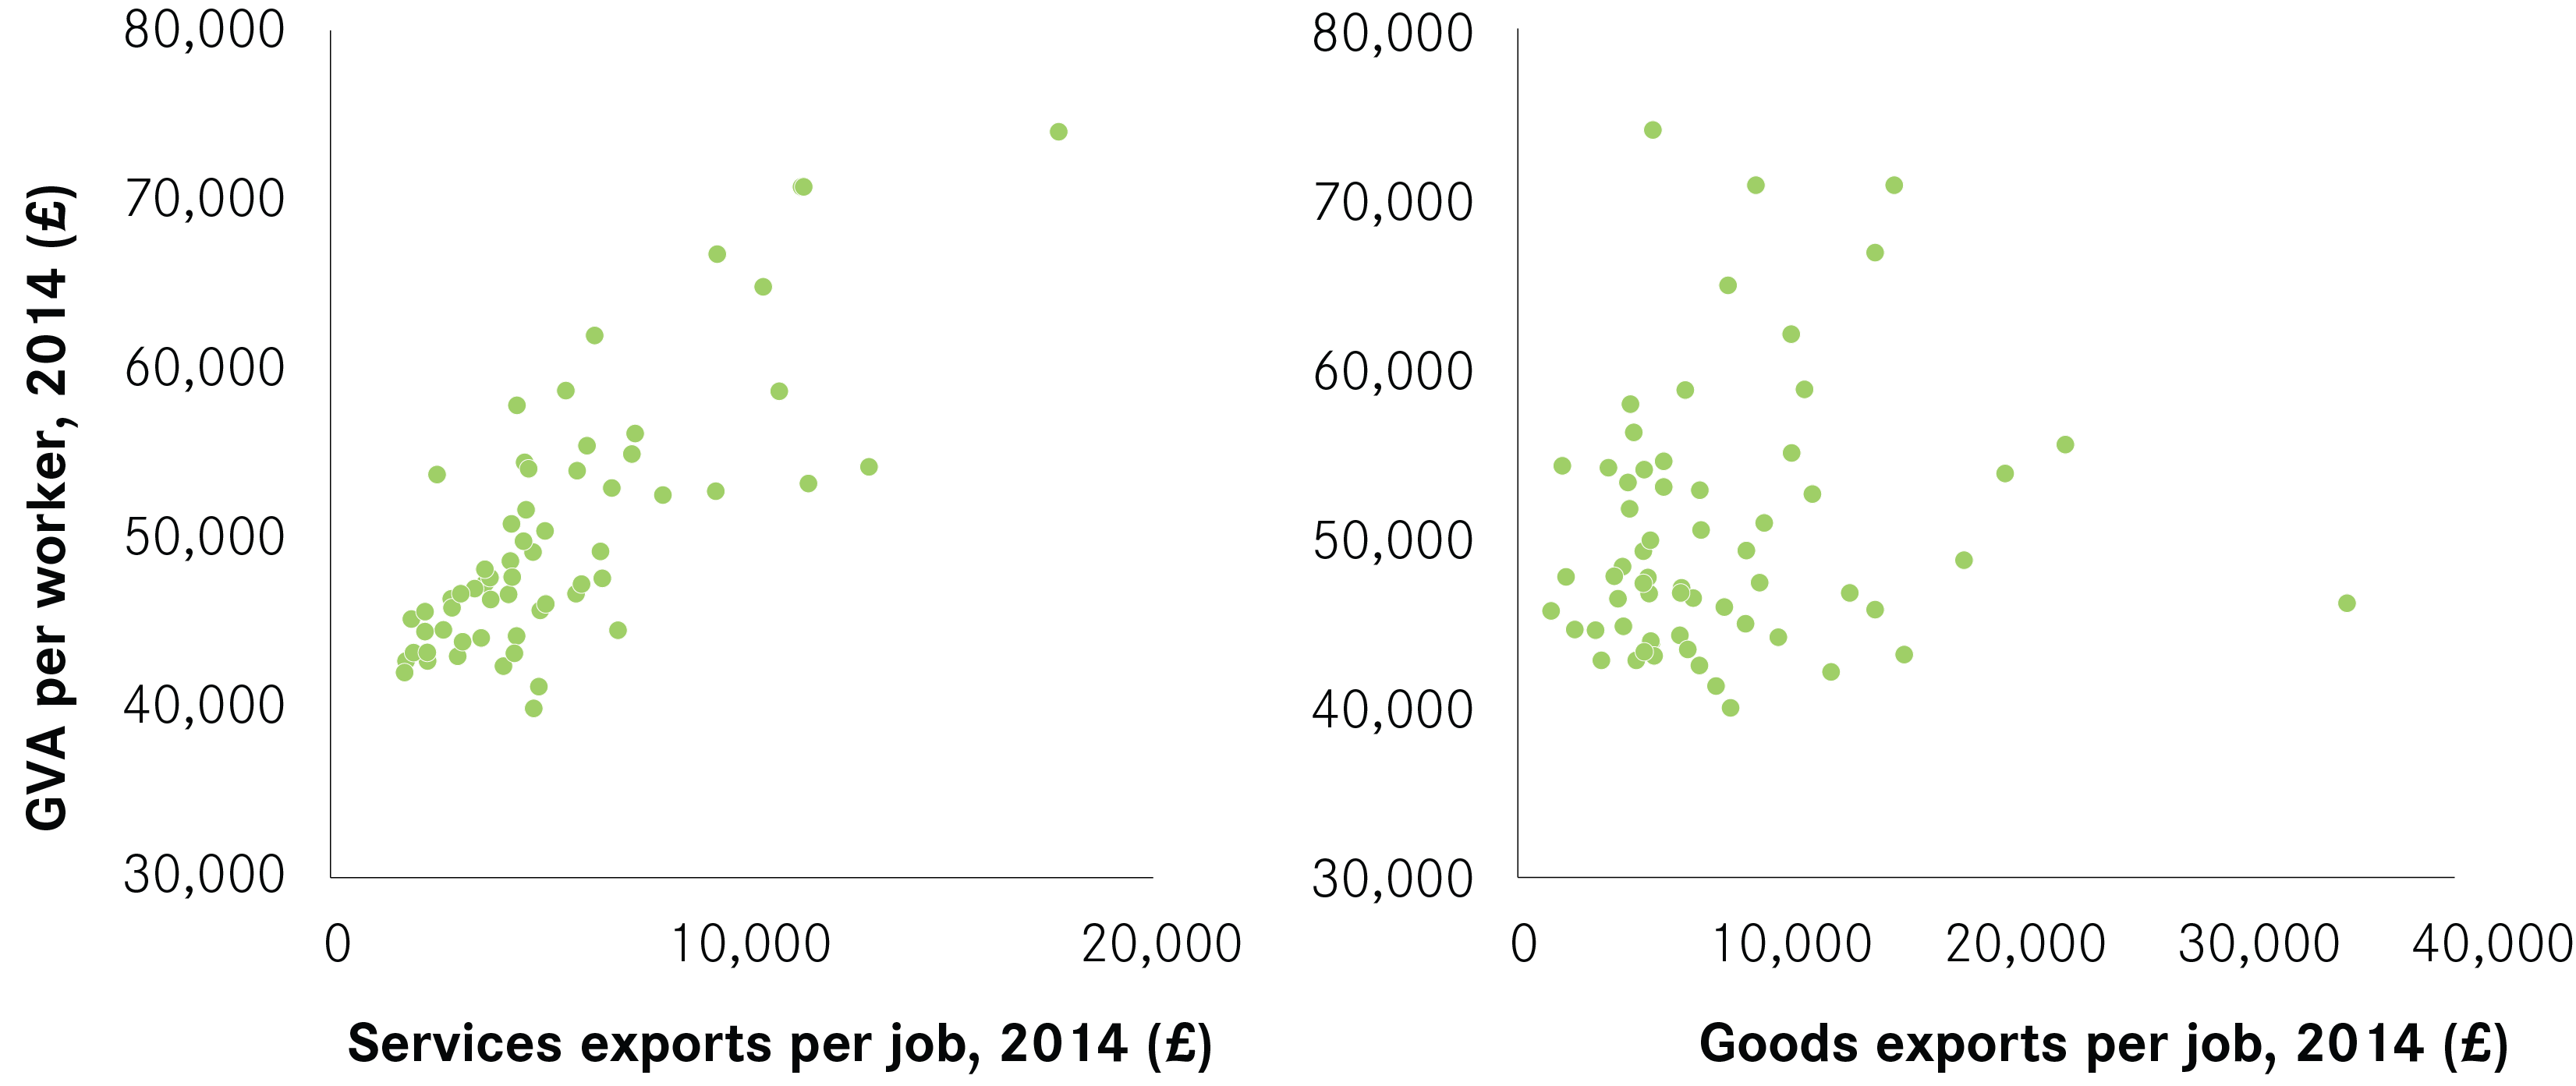
While there is a link between exporting industries and productivity at the national level, the impact that exporting has at the city level is much less clear cut. As Figure 11 shows, there does appear to be some relationship between exports per job and productivity2 for cities (a very similar relationship is also seen between exports per job and wages). However, this appears to be driven by services exports – there is very little relationship between goods exports and output per worker (See Figure 12).
This is likely to arise because of the way that manufacturing supply chains work relative to services and the impact that this has on measuring exports. To take Nissan’s Qashqai car as an example: it was designed in Paddington, engineered in Cranfield and is assembled in Sunderland. So while the car is assembled and exported from Sunderland, much of the ‘value add’ is carried out elsewhere. The relationship between services exports and productivity suggests that where the value add of services takes place is more closely aligned to where it is exported from than with goods exports.
This means that a UK strategy to boost productivity cannot simply focus on boosting exports; it needs to consider how to boost the value add of those exports. A place-based industrial strategy provides a good opportunity to ensure that policies to boost exports and productivity are tailored to city circumstances, looking at their productivity and export performance.
Figure 11: The relationship between exports and productivity
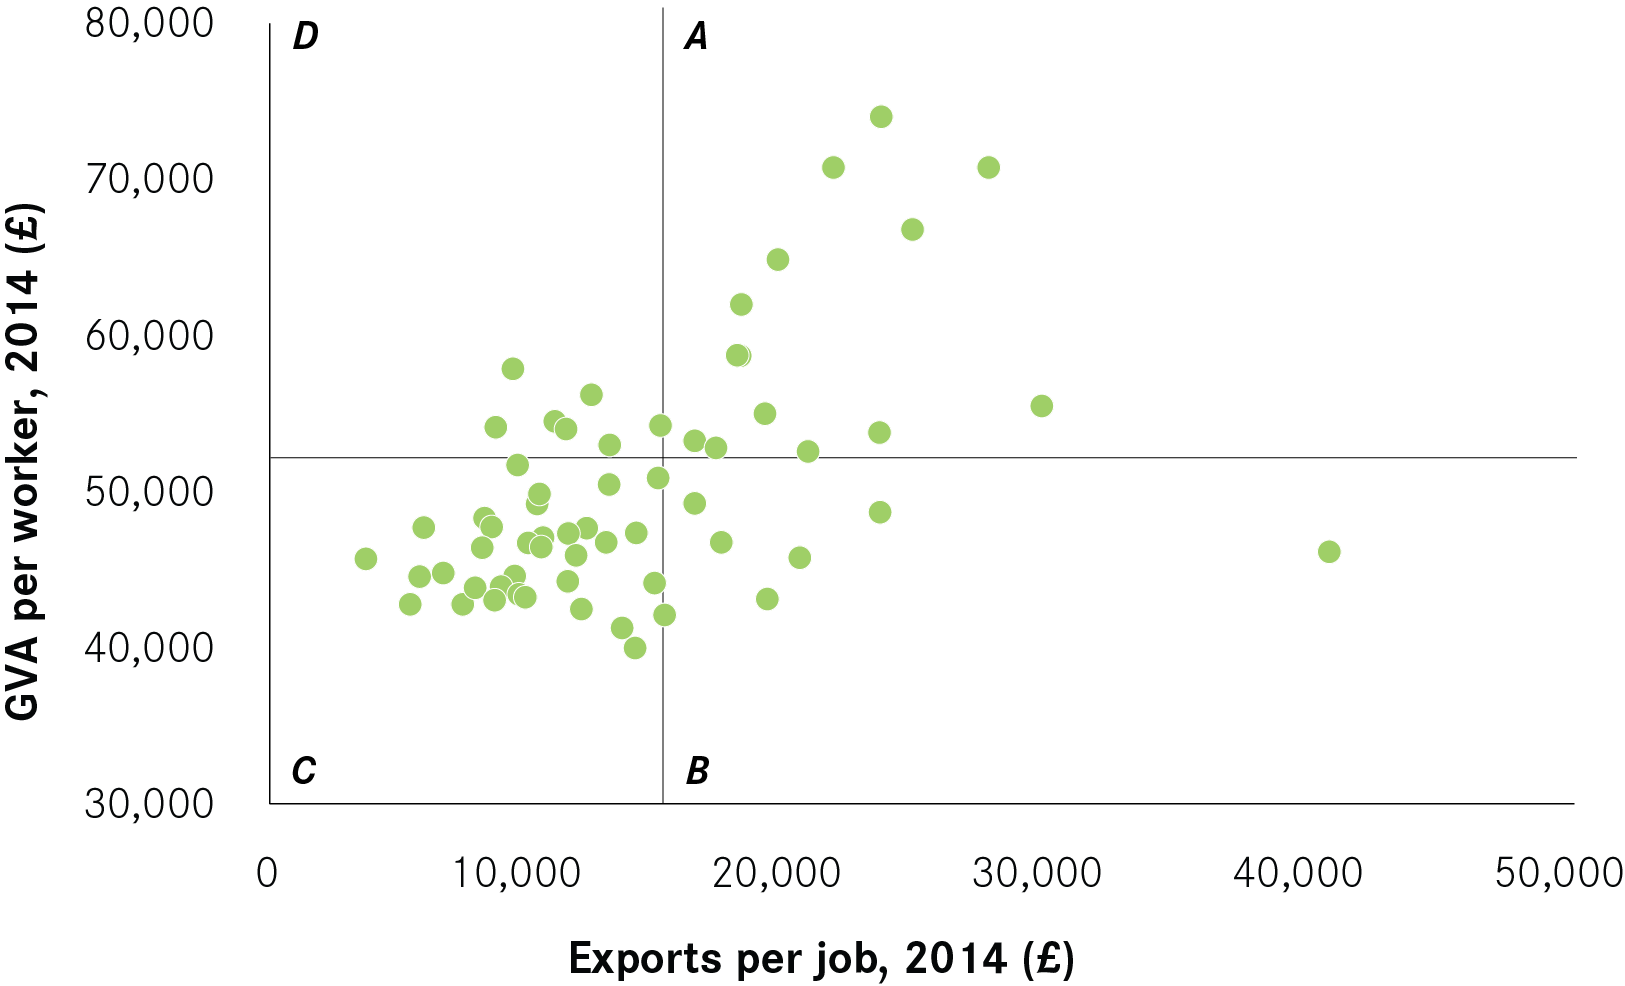
Figure 12: The relationship between services exports, goods exports and productivity
Industrial policy options for different cities
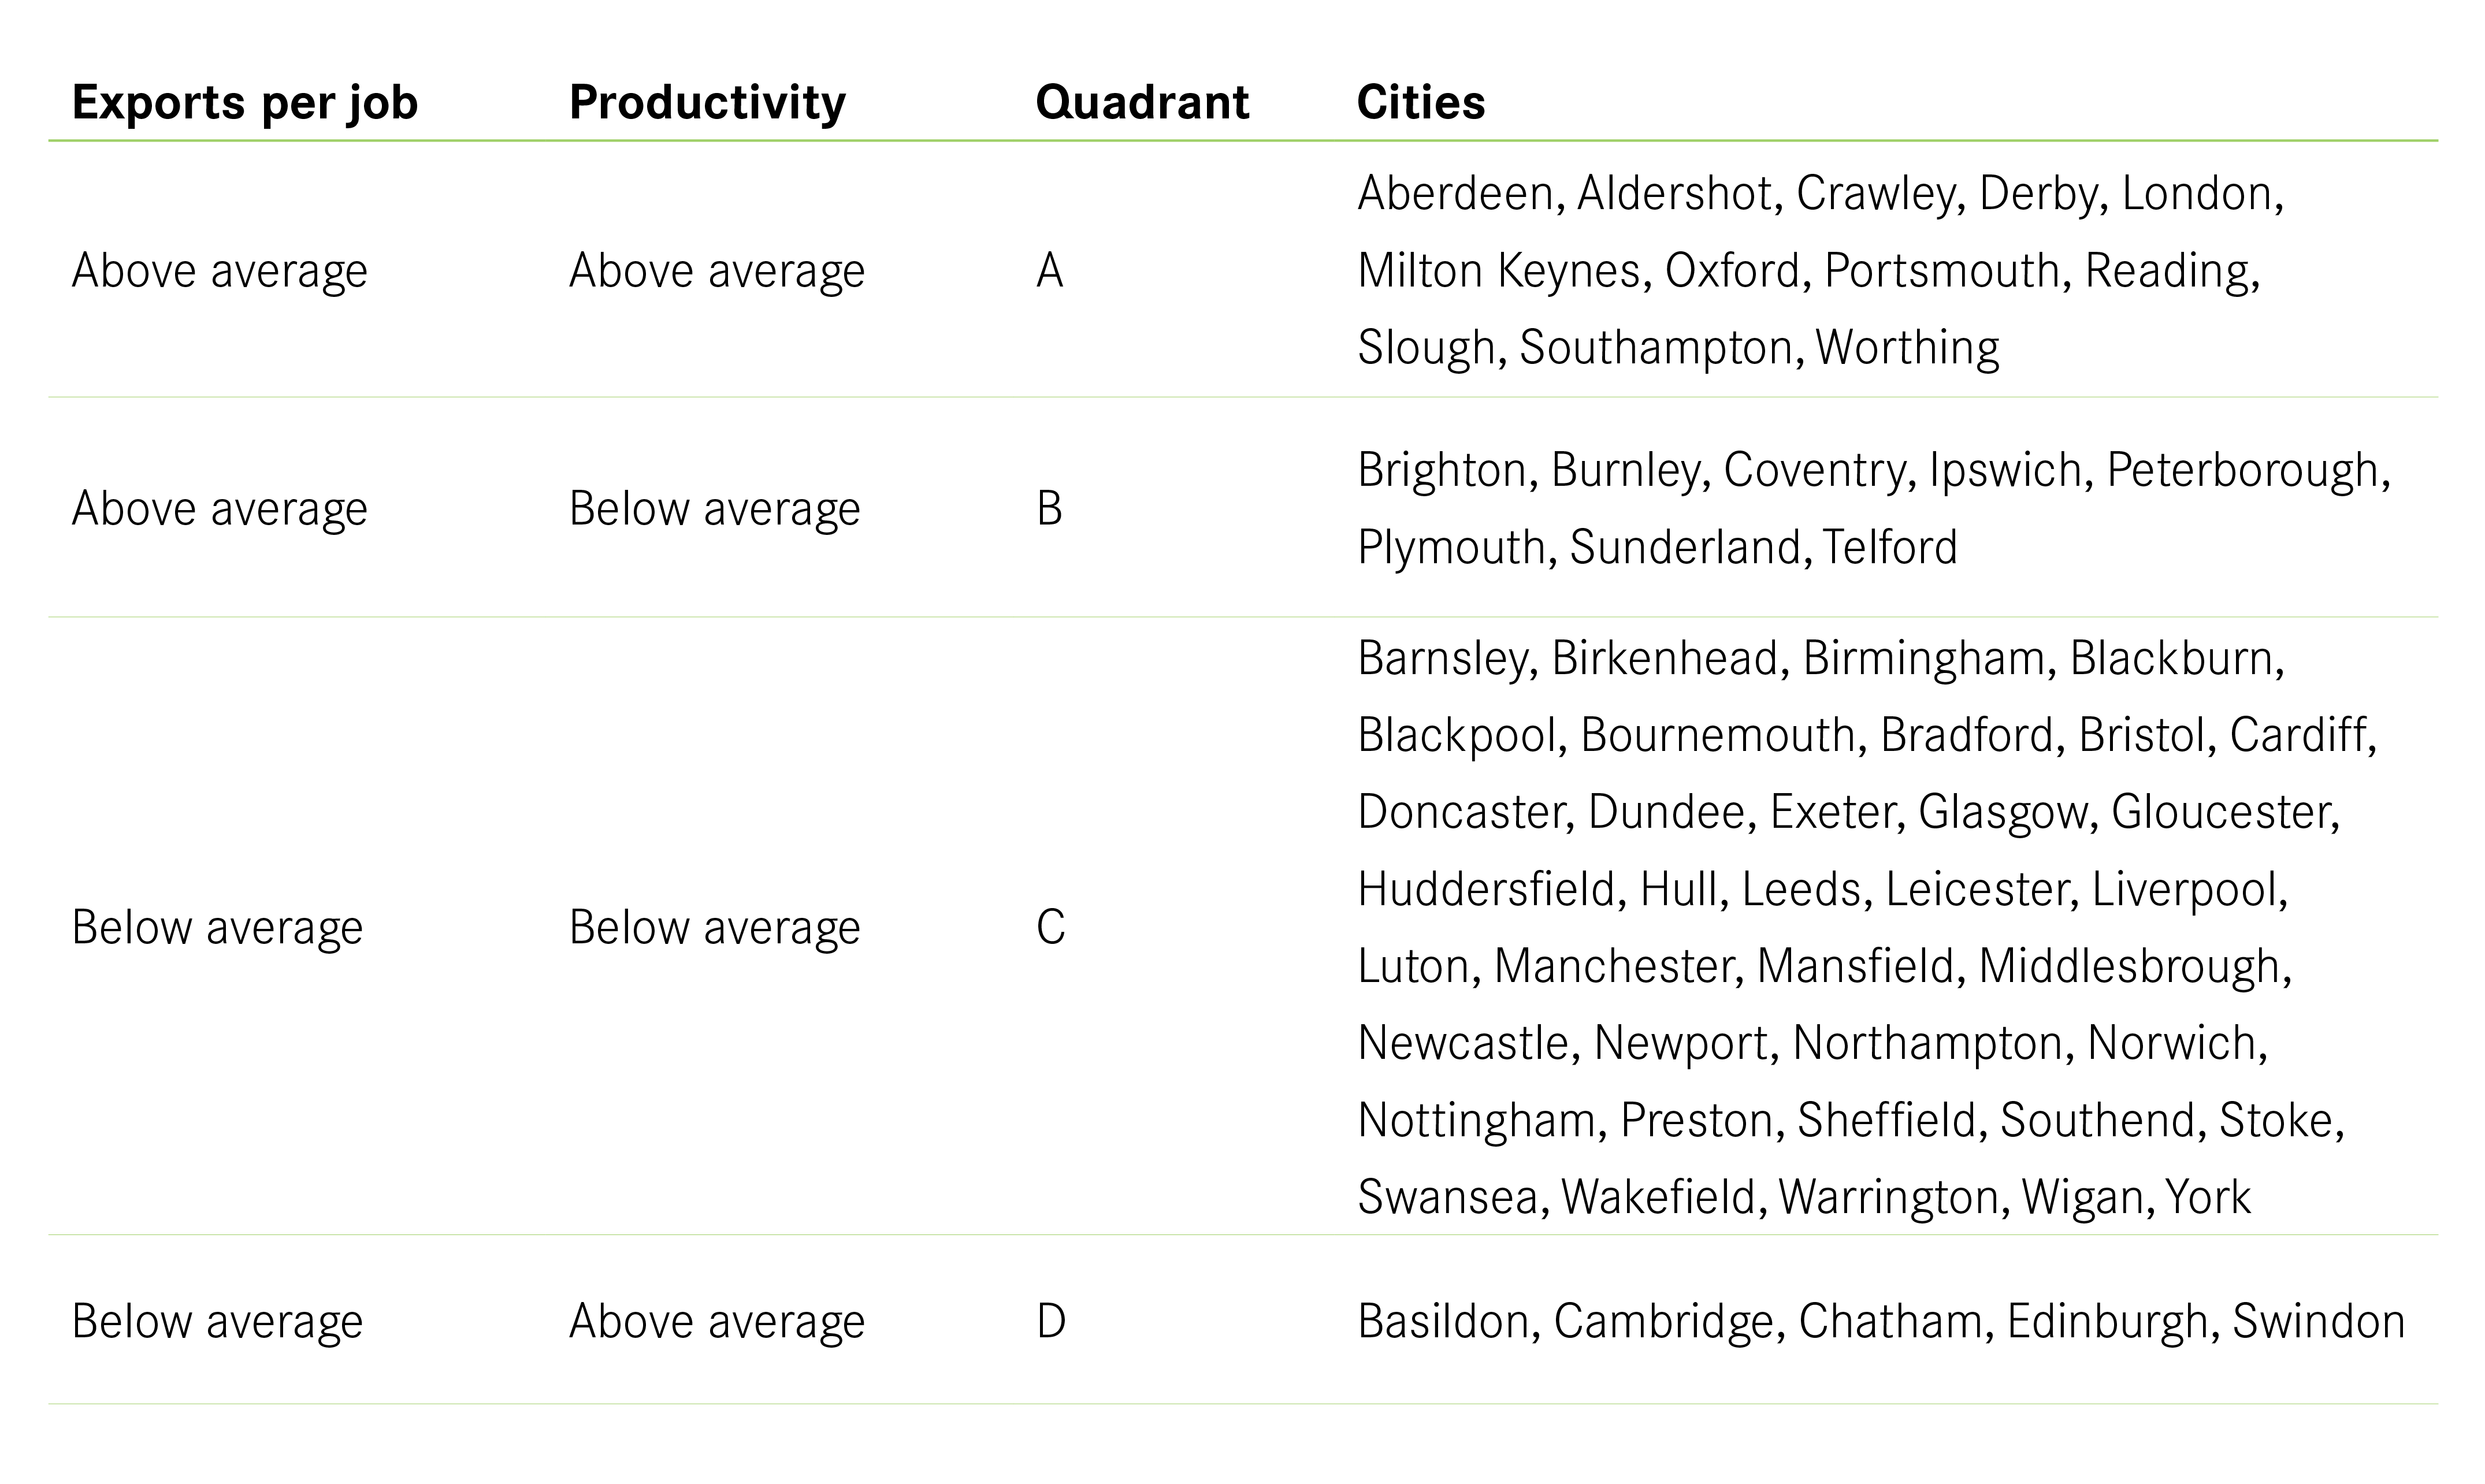
To help policymakers consider how this might work, we have split cities into four groups according to their performance in terms of exports and productivity. Figure 11 does this by looking at city performance relative to the national average for both indicators, and Figure 13 shows which cities fall into which categories.
Quadrant A has the top performers – those that have both above average exports per job and productivity. All but two of the 12 cities in this category (Derby and Aberdeen) are in the Greater South East. A policy focus on helping already successful businesses to expand into new markets would be the best way to support higher exports and contribute to higher productivity in these cities.
Cities in Quadrant D are likely to require a similar policy approach. That they have below average exports per job may suggest that businesses in their cities are successful at selling to businesses elsewhere in the UK, but are less successful at selling abroad. Again, support to export may be helpful in boosting growth.
Those cities in Quadrant B have less productive economies despite their high exports. This suggests that much of the ‘value add’ of the goods and services exported takes place outside these cities. While the exporting activity is important for local jobs, if these cities are to see an increase in both wages and productivity in the future, then the focus on policy should be on building on existing strengths to attract higher-value business investment and jobs.
It is notable that Quadrant C contains the most cities – 37 of 62 cities underperform the national average on both indicators. This urgently needs to improve if we are to boost the performance and productivity of the national economy. Policy should focus on improving the attractiveness of these cities as places for business investment for exporters through improving skills, local infrastructure and looking at existing strengths on which those cities can capitalise.
Figure 13: Grouping of cities according to exports per job and productivity
Summary and policy implications
Policy implications for trade deals
The EU was by far the biggest market for city exports in 2014, being three times larger than the USA and 11 times larger than China. While this of course is a static picture, to make up even a 10 per cent drop in current levels of UK cities’ exports to the EU would require more than a doubling in trade with China or increasing trade with the USA by nearly a third. And the variation seen across cities means that those negotiating the Brexit deal, as well as trade deals with other countries, will need to consider the geographical impact of the deals struck.
To make the most of city economies and boost UK productivity, trade deals will need to ensure they do not solely focus on one or two sectors but look more broadly. Many high profile sectors, such as the car industry, are concentrated in a small number of places. For example, striking a deal on cars would benefit Swindon and Sunderland, and deliver a tangible political win, but it would do little for many other cities where there are few jobs related to the car industry.
It will be important to ensure that places that are heavily reliant on one industry are considered and supported, but given that large parts of the export base are spread across the country, negotiators should consider how they can reach an agreement for all goods and services to support UK cities to continue exporting to the EU and beyond.
Implications for place-based industrial policy
Given the role of exporters in increasing productivity of economies, part of the Government’s efforts to increase the UK’s productivity will require a better understanding of why some places export so little. Many export policies in the past have been focused on attempting to encourage existing businesses to export more, through interventions such as export credit. There is a role for this. But the bigger question in many places may be about asking why exporters do not choose to locate in these cities in the first place. This means that part of a plan to increase the exports of a city has to be about improving its economic fundamentals, particularly skills, to make it more attractive to business investment.
Having high exports does not necessarily go hand in hand with having a more productive economy; while some cities with low productivity have been successful at exporting, to improve their economies they will need to attract in higher-value business investment. The problem is not that these cities don’t export, but that their contribution to the product that they export is not necessarily that large. For these cities, while celebrating their success in exporting is important, it should not be done at the expense of addressing the underlying challenges in their economies that limit the number of higher-paid jobs available to the people who live in and around them.
Box 3: Methodology
To estimate exports by city, two data sources were used – HMRC’s regional trade data and the ONS’ estimates of services exports by region.
To move from regional to city level estimates, the regional data was apportioned according to the regional share of jobs in each city. So if
Birkenhead, for example, was home to 15 per cent of the North West’s car manufacturing jobs, then it was assumed that it also accounted for 15
per cent of the region’s car exports. To match the export classifications
to sectors, the following was done:
- For services, the apportionment was straightforward, using the broad Standard Industrial Classification codes that roughly match the sectors ONS used to present the regional services export data.
- For goods, the Standard International Trade Classification (which classifies goods exports) was mapped on to the Standard Industrial Classification codes (which are used to classify jobs by industry).
The goods data is cut by country of destination, but the services exports data is not. To create estimates of where cities export to, it was assumed that the proportion of services exported to a country was the same as the proportion of goods sent to that country. Analysis of national trade data suggests that this assumption broadly holds.