
02Five facts about the Randstad and Rhine-Ruhr, with comparison to the Northern Powerhouse
Fact 1: The Randstad and Rhine-Ruhr are more productive than the Northern Powerhouse, but economic activity is concentrated in specific places.
As a whole, the Randstad and Rhine-Ruhr areas lead their respective national economies, being more productive (measured using GVA per worker) than their countries as a whole. This is not the case in the Northern Powerhouse (see Figure 3), where productivity is 14 per cent lower than the national average. And at £45,000 in 2013, productivity in the North was below both the Randstad (£62,000) and Rhine-Ruhr (£56,000) areas.
So the stronger performance of the Randstad and Rhine-Ruhr suggests that there are lessons to be learned from the two areas that would benefit the Northern Powerhouse, as suggested in the various strategy documents and speeches on this policy initiative to date.
Figure 3: Productivity relative to the national average, 2013
But this economic activity is not spread out throughout the two areas. As Figure 4 shows, in line with the theory of agglomeration, the economy is concentrated in specific places.
- In the Randstad, the economy is concentrated in the two largest cities of Amsterdam and Rotterdam. Despite accounting for just 10 per cent of land, these cities accounted for 34 per cent of all jobs in the area in 2014.13 They were also the two most productive parts of the Randstad in 2013.14
- In the Rhine-Ruhr area, Cologne and Düsseldorf are by far the two largest cities. Accounting for just 6.8 per cent of land, they were home to 22 per cent of all of the Rhine-Ruhr’s jobs in 2015. They were also two of the three most productive municipalities in the Rhine-Ruhr in 2013.
Figure 4: The geography of jobs in the Northern Powerhouse, Randstad and Rhine-Ruhr areas

This is particularly the case for knowledge-based jobs. In the Rhine-Ruhr, Cologne and Düsseldorf accounted for 35 per cent of all private sector knowledge intensive business services (KIBS) jobs,15 and 45 per cent of all financial services jobs (a subset of KIBS jobs). While data is not available to look at KIBS jobs at the local level in the Randstad, it does show that financial services are similarly concentrated – in 2014 the two largest cities accounted for 48 per cent of the Randstad’s jobs in this sector.
This is important for a number of reasons. Firstly, these jobs tend to be higher skilled and better paid. Secondly, advanced economies are likely to continue to specialise in these types of activities, and so will be an important source of jobs growth. And finally, research suggests that jobs created in these sectors create jobs in other sectors such as retail and leisure.16
Similar patterns are seen across the Northern Powerhouse. The two largest cities of Manchester and Leeds, despite accounting for 4.3 per cent of land in the North, account for 24 per cent of all jobs and 35 per cent of all private KIBS jobs. In total, the North’s 21 cities account for only 20 per cent of land, but 70 per cent of jobs.
As Figure 4 shows, jobs are especially clustered in city centres. In 2015, 7.5 per cent of the North’s private sector jobs were located in its five largest city centres,17 despite them accounting for just 0.07 per cent of all land. And 17.3 per cent of all private sector KIBS jobs were located there.
But whereas the largest cities of the Randstad and Rhine-Ruhr are the most productive parts of their wider areas, the cities of the North are not. As Figure 5 shows, not one northern city has productivity above the UK average.
Figure 5: Productivity relative to the national average, 2011
Fact 2: Commuting links show city regions to be distinct, rather than operating as part of a larger, single economy
An argument often put forward about both the Randstad and Rhine-Ruhr area is that their transport links allow people to live in one city but work in another, suggesting that there would be benefits for the North of England in strengthening transport links between cities. But the data suggests that people don’t use the transport links in this way.
The share of people who both live and work within a particular city region is very similar across the three areas. As Figure 6 shows, 10 of the 13 city regions in the three areas have containment rates between 82 and 89 per cent. At 76 per cent, Utrecht is the only exception, mainly because of the large levels of commuting to the Amsterdam Metropolitan Area.18
Figure 6: Containment in city regions

This means that commuting links between city regions tend to be quite low:
- In the Rhine-Ruhr, Düsseldorf, located between the two other city regions in the area, has the largest share of residents commuting to other city regions. But this equates to no more than 6 per cent of total working residents to each of the other two, and is not dissimilar to the 4 per cent of working residents in Liverpool City Region that commute to Greater Manchester each day, or the 5 per cent of Sheffield City Region’s working residents that travel to the wider Leeds area19 to work.
- Similar patterns are seen in the Randstad too. While 12 per cent of Utrecht’s working residents travel to Amsterdam, this is very much the exception – the next highest flow is the 5 per cent of Amsterdam residents that work in Utrecht.
Highly skilled workers do tend to commute further.20 But they tend to commute from the rural hinterlands of the cities they work in, rather than from other cities. Most city regions have stronger links between the central city and surrounding hinterland than with other city regions within the Northern Powerhouse. Figure 7 shows where Greater Manchester’s workers live. The spread of those working in high-skill occupations stretches further into Lancashire to the north and Cheshire and the Peak District to the south than for all workers. But even given this greater spread, 78 per cent of these highly skilled workers still choose to live in Greater Manchester.
These patterns, evident across all three areas, appear to suggest that if a worker wants to live in a city, they will mostly choose to live in the city that they work within. Otherwise they will choose to live in the countryside surrounding the city they work in, rather than another city.
Figure 7: Commuting patterns of all and high-skill occupations into Greater Manchester
Fact 3: Public transport usage is similar across the three areas, but the modes used are different
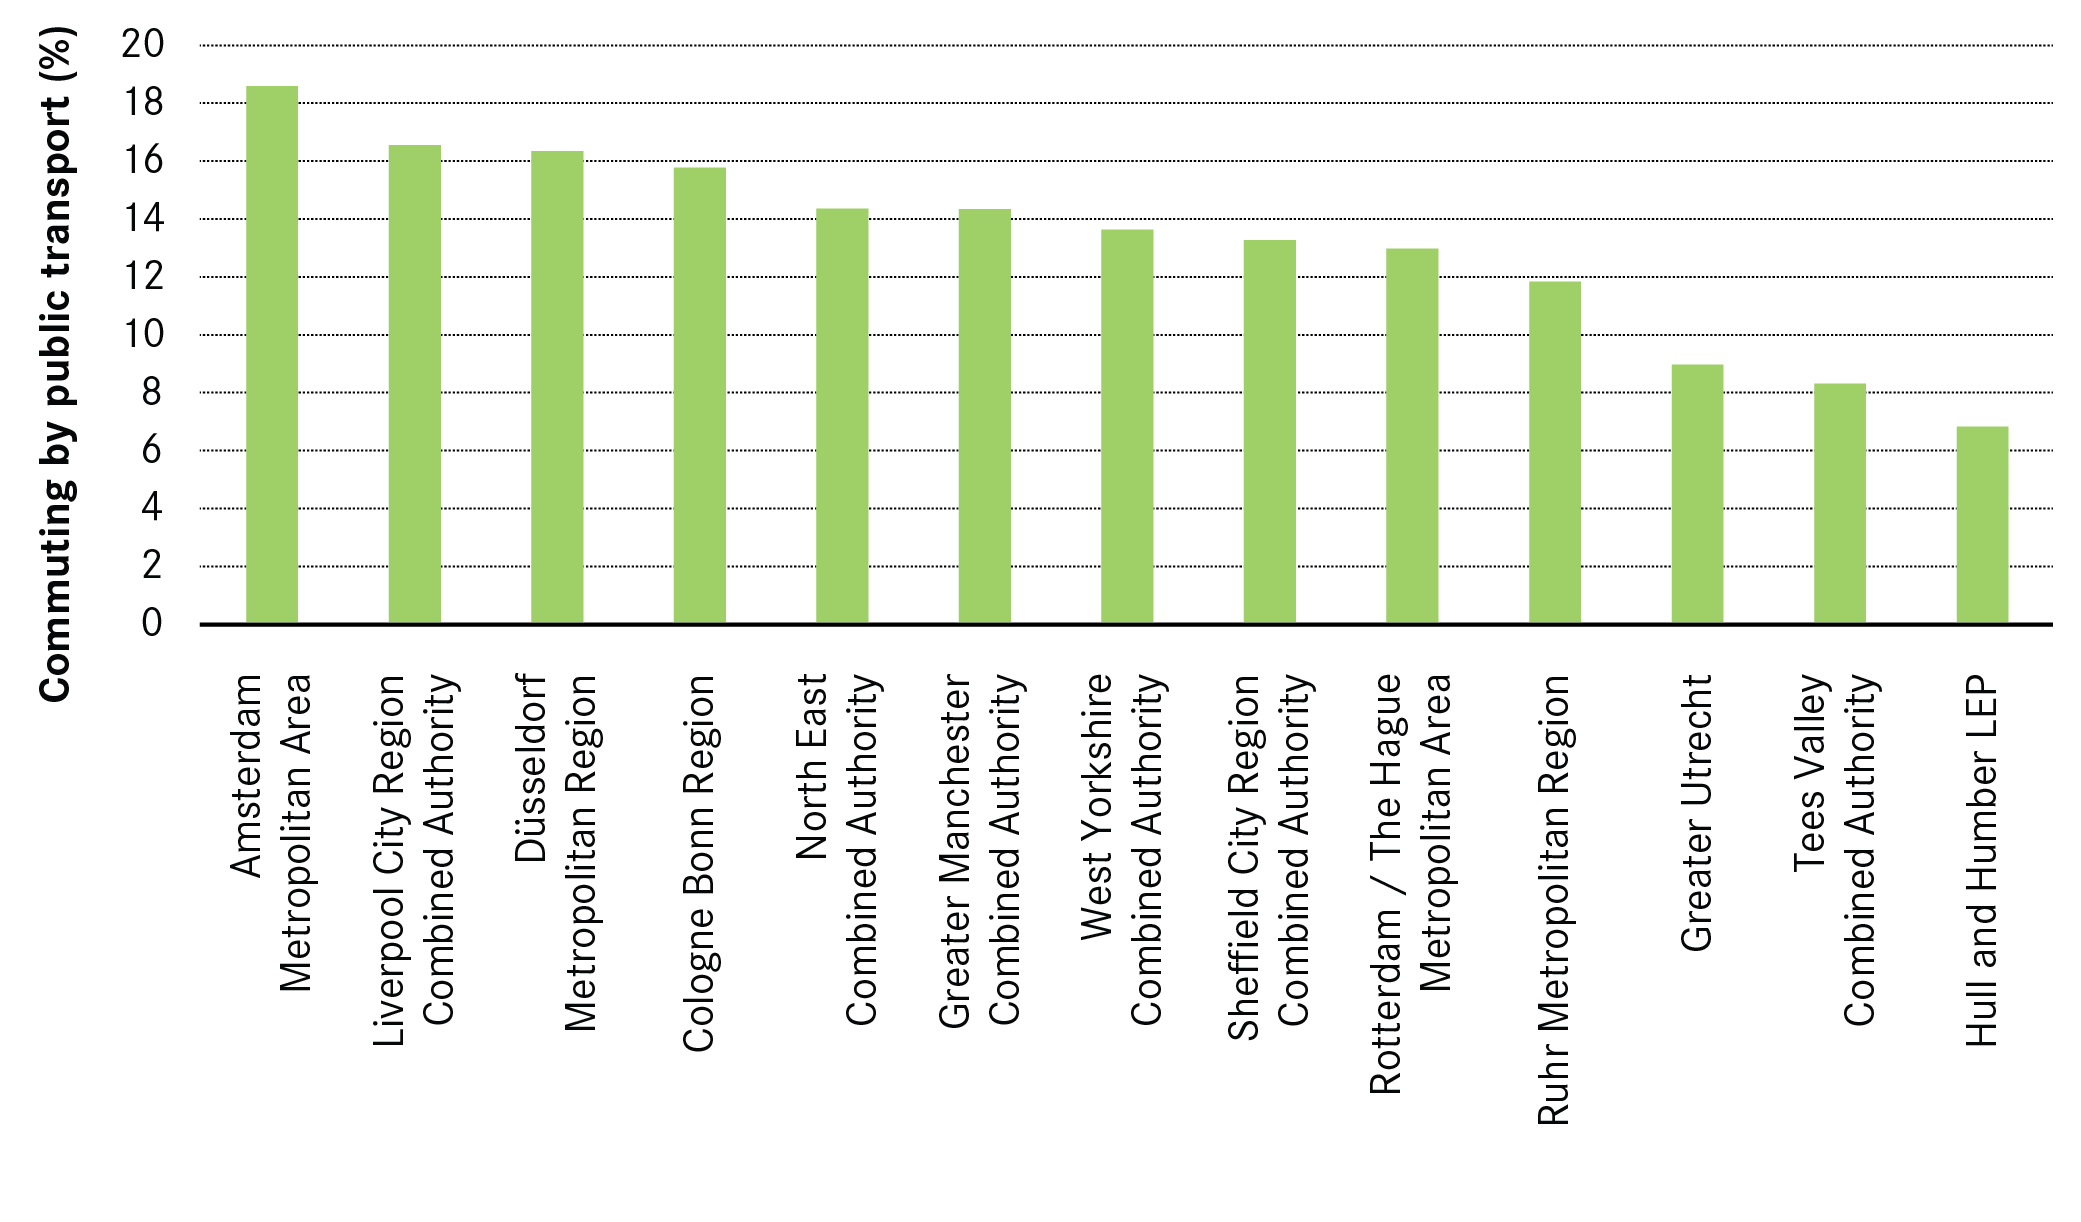
Public transport usage by commuters tends to be similar across the city regions too (see Figure 8). With the exception of the Tees Valley and Hull and Humber, a range of between 11 and 19 per cent of commuters across the city regions use public transport to work. The striking thing about these figures is not only that they are very similar, but they are also quite low. By comparison, 45 per cent of Londoners use public transport to get to work.
Figure 8: Residents commuting via public transport in city regions
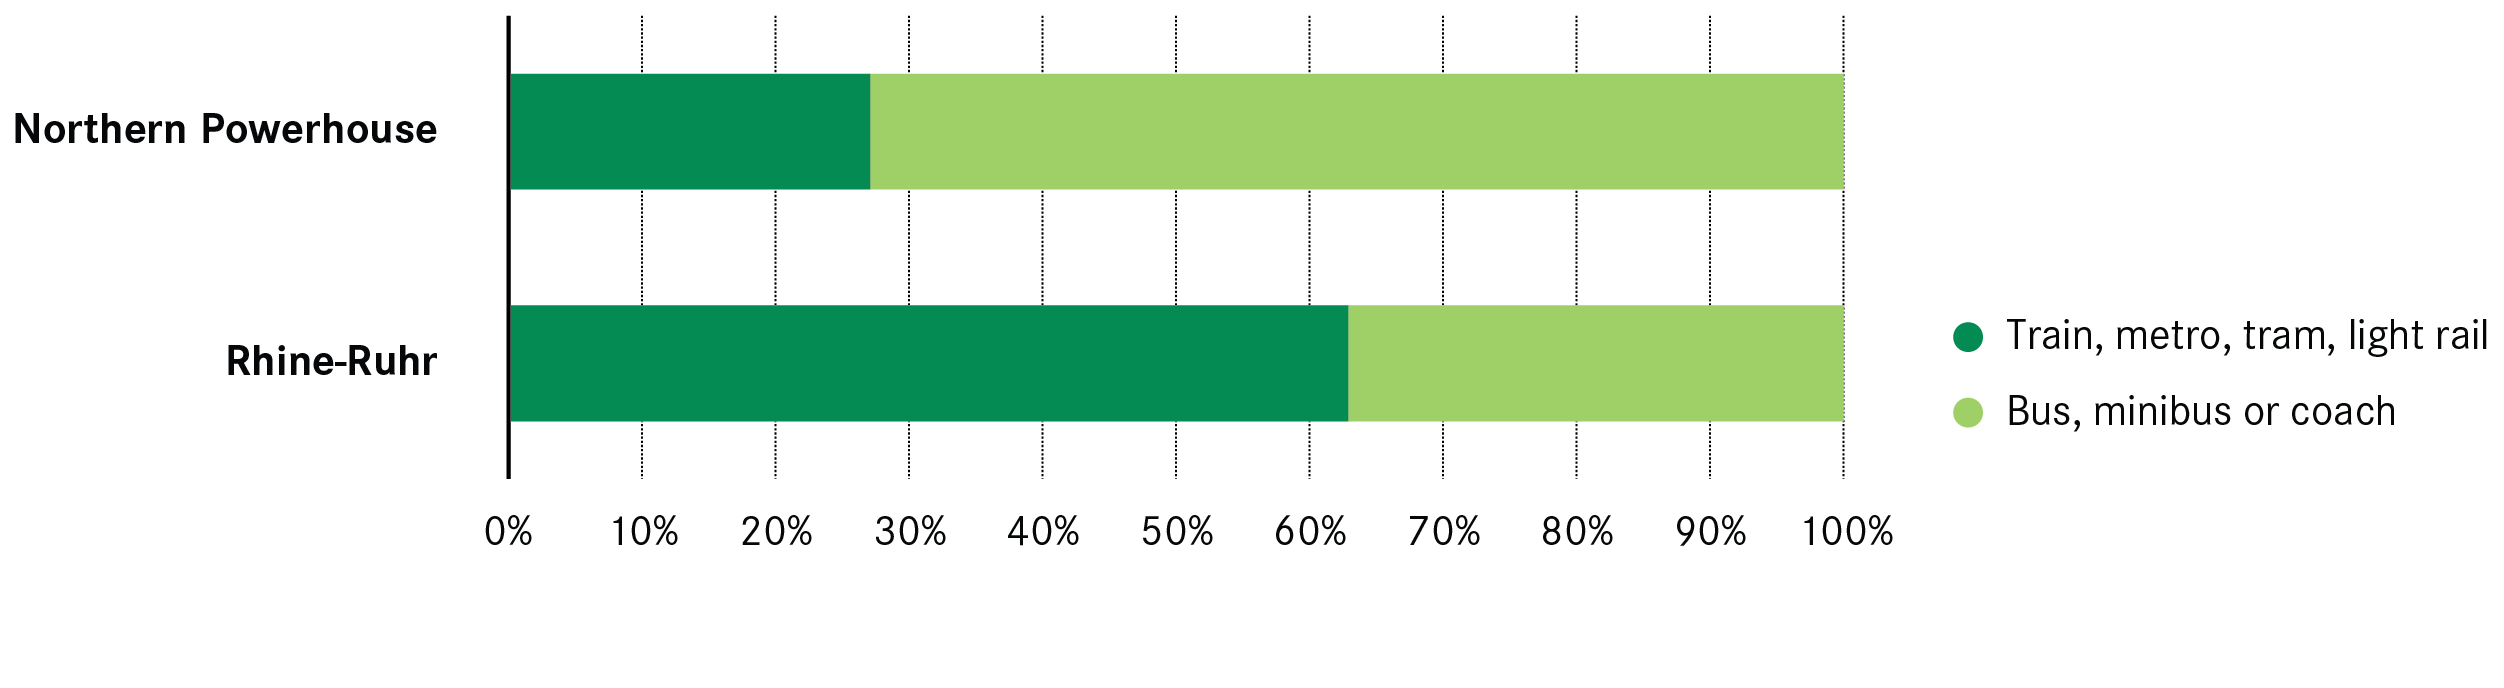
What is different is the mix of public transport used. Figure 9 shows that the share of commuters using the bus to commute in northern English city regions is much higher than in the Rhine-Ruhr area, where the use of metro and train services is more popular. A split between bus and tram usage is not given in the Dutch data, but trains alone account for over 40 per cent of all commutes by public transport in the Randstad.21
Figure 9: Resident commuting by mode of public transport in city regions
Fact 4: It is frequency, rather than speed, that separates the rail networks
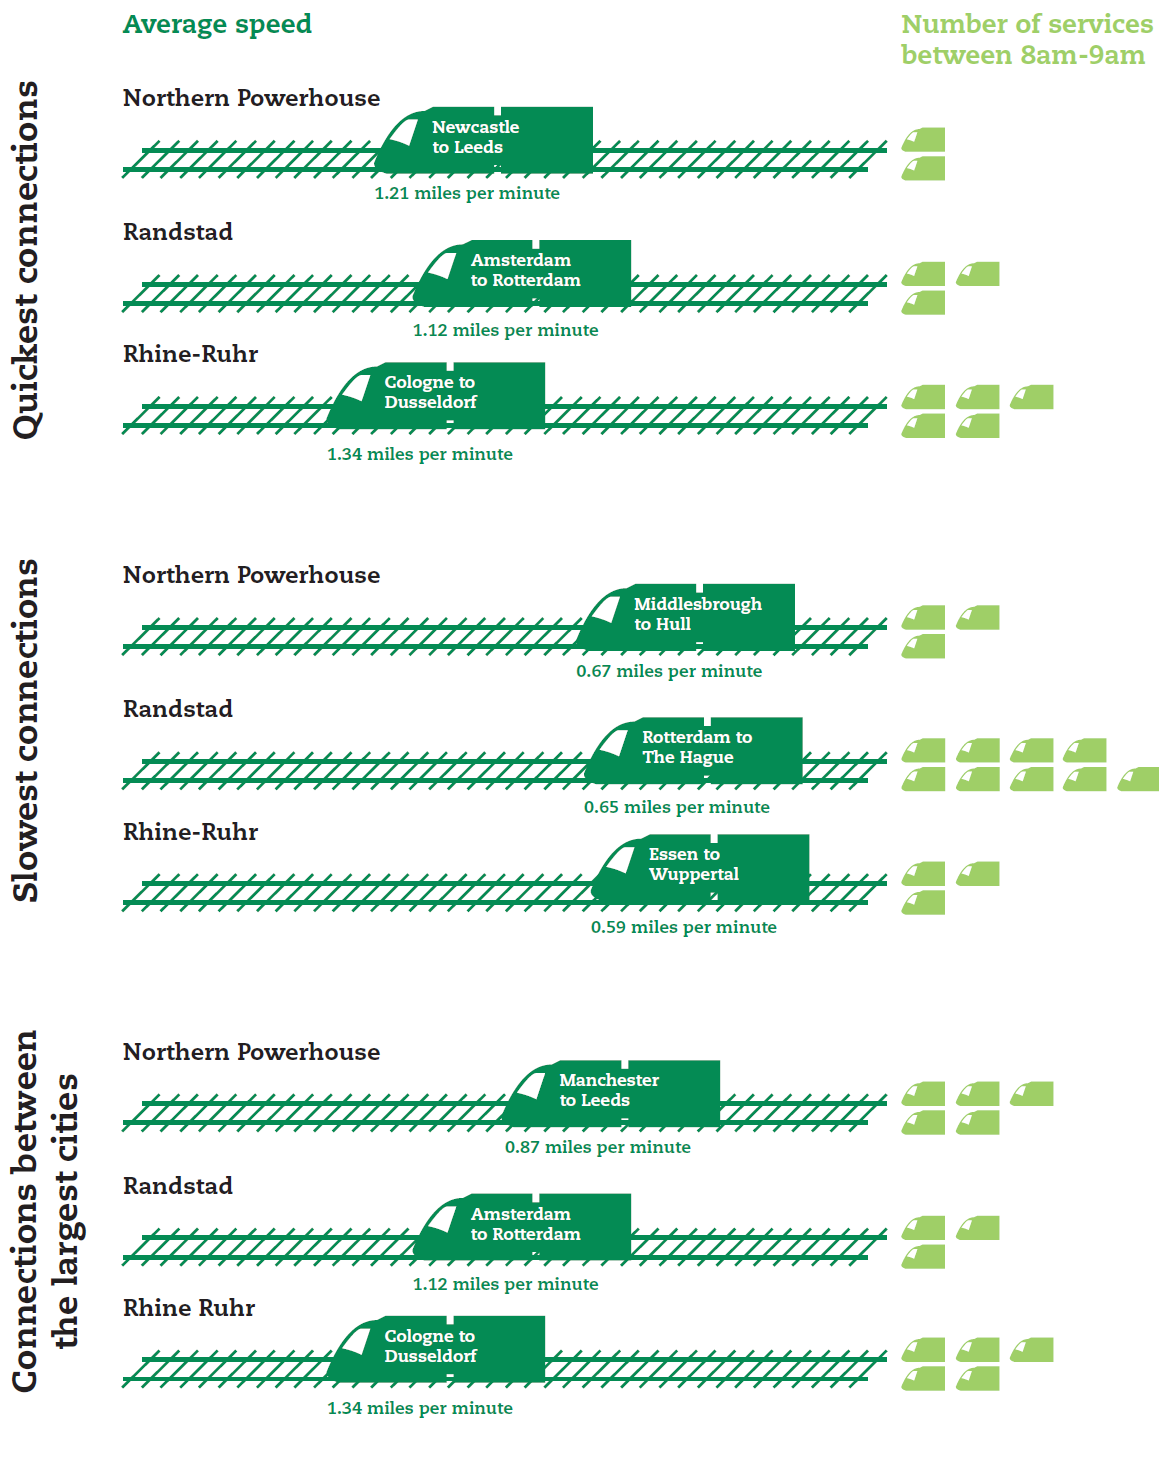
The speeds achieved by intercity rail connections between the cities of the Randstad and Rhine-Ruhr are not a great deal quicker than between cities in the Northern Powerhouse.
- With the exception of the Cologne-Düsseldorf-Duisburg link, speeds are not much quicker than connections across northern cities. And even the Cologne-Duisburg link is not as quick as connections into London from Reading and Milton Keynes.22
- Speeds in the Randstad also outperform links between northern English cities, but again not significantly. And the link between Rotterdam and the Hague is slower than any connection between the principal cities of city regions in the North of England.
Where there is a big difference is in frequency. As Figure 10 shows, there is a much higher number of services between the cities of the Randstad and Rhine-Ruhr than in the Northern Powerhouse. Despite this, commuting data above shows that this has not resulted in a larger share of commutes made by public transport, although it may help explain why trains are more popular than bus journeys.
Figure 10: Frequency and speed of services between cities
Fact 5: Neither the Randstad or Rhine-Ruhr have institutions that plan or manage activity or investment at this scale
Although both the Randstad and Rhine-Ruhr are frequently presented as ‘mega cities’ in Europe, there is no regional body in place that looks at economic development or inward investment across the two areas.
In the Randstad, responsibilities are split between provinces (of which there are four) and municipalities (of which there are 135); the former, for example, look after regional transport, while the latter look after economic development and education. Meanwhile local transport is the responsibility of separate local transport bodies.23
In the Rhine-Ruhr, sub-national governance falls between the federal State of North Rhine Westphalia (which is larger than the Rhine-Ruhr area), 30 districts and 110 municipalities.24 The State has a wide number of responsibilities including education, while the districts have powers over planning, local transport and tax raising.25
Reflections
These five findings reveal two main characteristics about agglomeration in the Randstad and Rhine-Ruhr. Firstly, jobs are very concentrated in a few places rather than spread out across both areas. This appears to be particularly the case for more knowledge-based jobs that benefit from greater density and proximity. This suggests that knowledge spillovers play out over small areas in the cities of the Randstad and Rhine-Ruhr, as they do in other cities.
Secondly, both the Randstad and Rhine-Ruhr areas do not act as one labour market but as a number of them. This means that transport systems within city regions are more important for enabling businesses to access workers and workers to access jobs than transport links between cities.
The most significant implication of these findings is that the underperformance of northern cities is not chiefly down to poor transport links between them. The cities of the Randstad and Rhine-Ruhr happen to be close together, rather than operating as one economy, so do not provide a model for creating a unified economy across the North of England by improving transport links between them. Instead, the model of the Randstad and Rhine-Ruhr suggests that if the Northern Powerhouse is to be successful, then it must primarily focus on making its cities more attractive to business investment.