04Creating a more effective local funding system
In order to provide cities with the resources and incentives to support economic growth and deliver the services people need more effectively and efficiently, we need to go further with fiscal devolution. In doing so the government should be thinking about how to:
- Diversify the local tax base;
- Encourage pooling between authorities at city-region level;
- Devolve responsibilities (alongside taxes) where cities can make a difference.
1. Diversifying
Over reliance on a narrow tax base is risky. Developing a portfolio approach with more control over a broader range of tax revenues would give cities more funding certainty and incentives to support economic growth.
In addition to council tax and business rates, stamp duty and other property taxes should be devolved to local government. Stamp duty generated £10 billion in 2014-15, including the £3 billion from local sales, fees and charges. Devolving this would give local government control over 41 per cent of what was spent in 2014-15 (£140 billion).
Figure 6: Local revenues as a share of local spend, 2014-15

Land and property taxes are well suited to devolution as they are non-mobile and non-redistributive taxes, which means they are less likely to cause tax competition and tax distortions between places.32 In a small country like England, it is not desirable to see individual local authorities competing on income tax rates, for example. Both the London Finance Commission and the Core Cities in Britain have called for the devolution of land and property taxes to cities.
Box 2: Land and property taxes
Council tax is levied on households by local authorities, based on the estimated value of a property (currently based on 1991 values) and the number of people living in it.
Business rates Business rates are levied on non-domestic properties based on their rateable value (currently based on 2010 values). 50 per cent of the revenue generated is retained by local government, which is redistributed by central government to local authorities according to a system of top-ups, tariffs and growth levies.
Stamp Duty Land Tax is levied on land transactions for both residential non-residential properties above a sale price of £125,000.
The Annual Tax on Enveloped Dwellings (ATED) is levied on companies that own residential property valued at more than £1 million.
| Land and property taxes | 2014-15 revenue in England |
|---|---|
| Council tax | £24,052,365,000 |
| Business rates | £23,066,362,000 |
| Stamp duty | £10,027,000,000 |
| Annual Tax on Enveloped Dwellings | £116,207,236 |
What would this look like across local authorities?
Because of the varying levels of taxes generated and local government spending in different localities, devolving land and property taxes will look different from place to place.
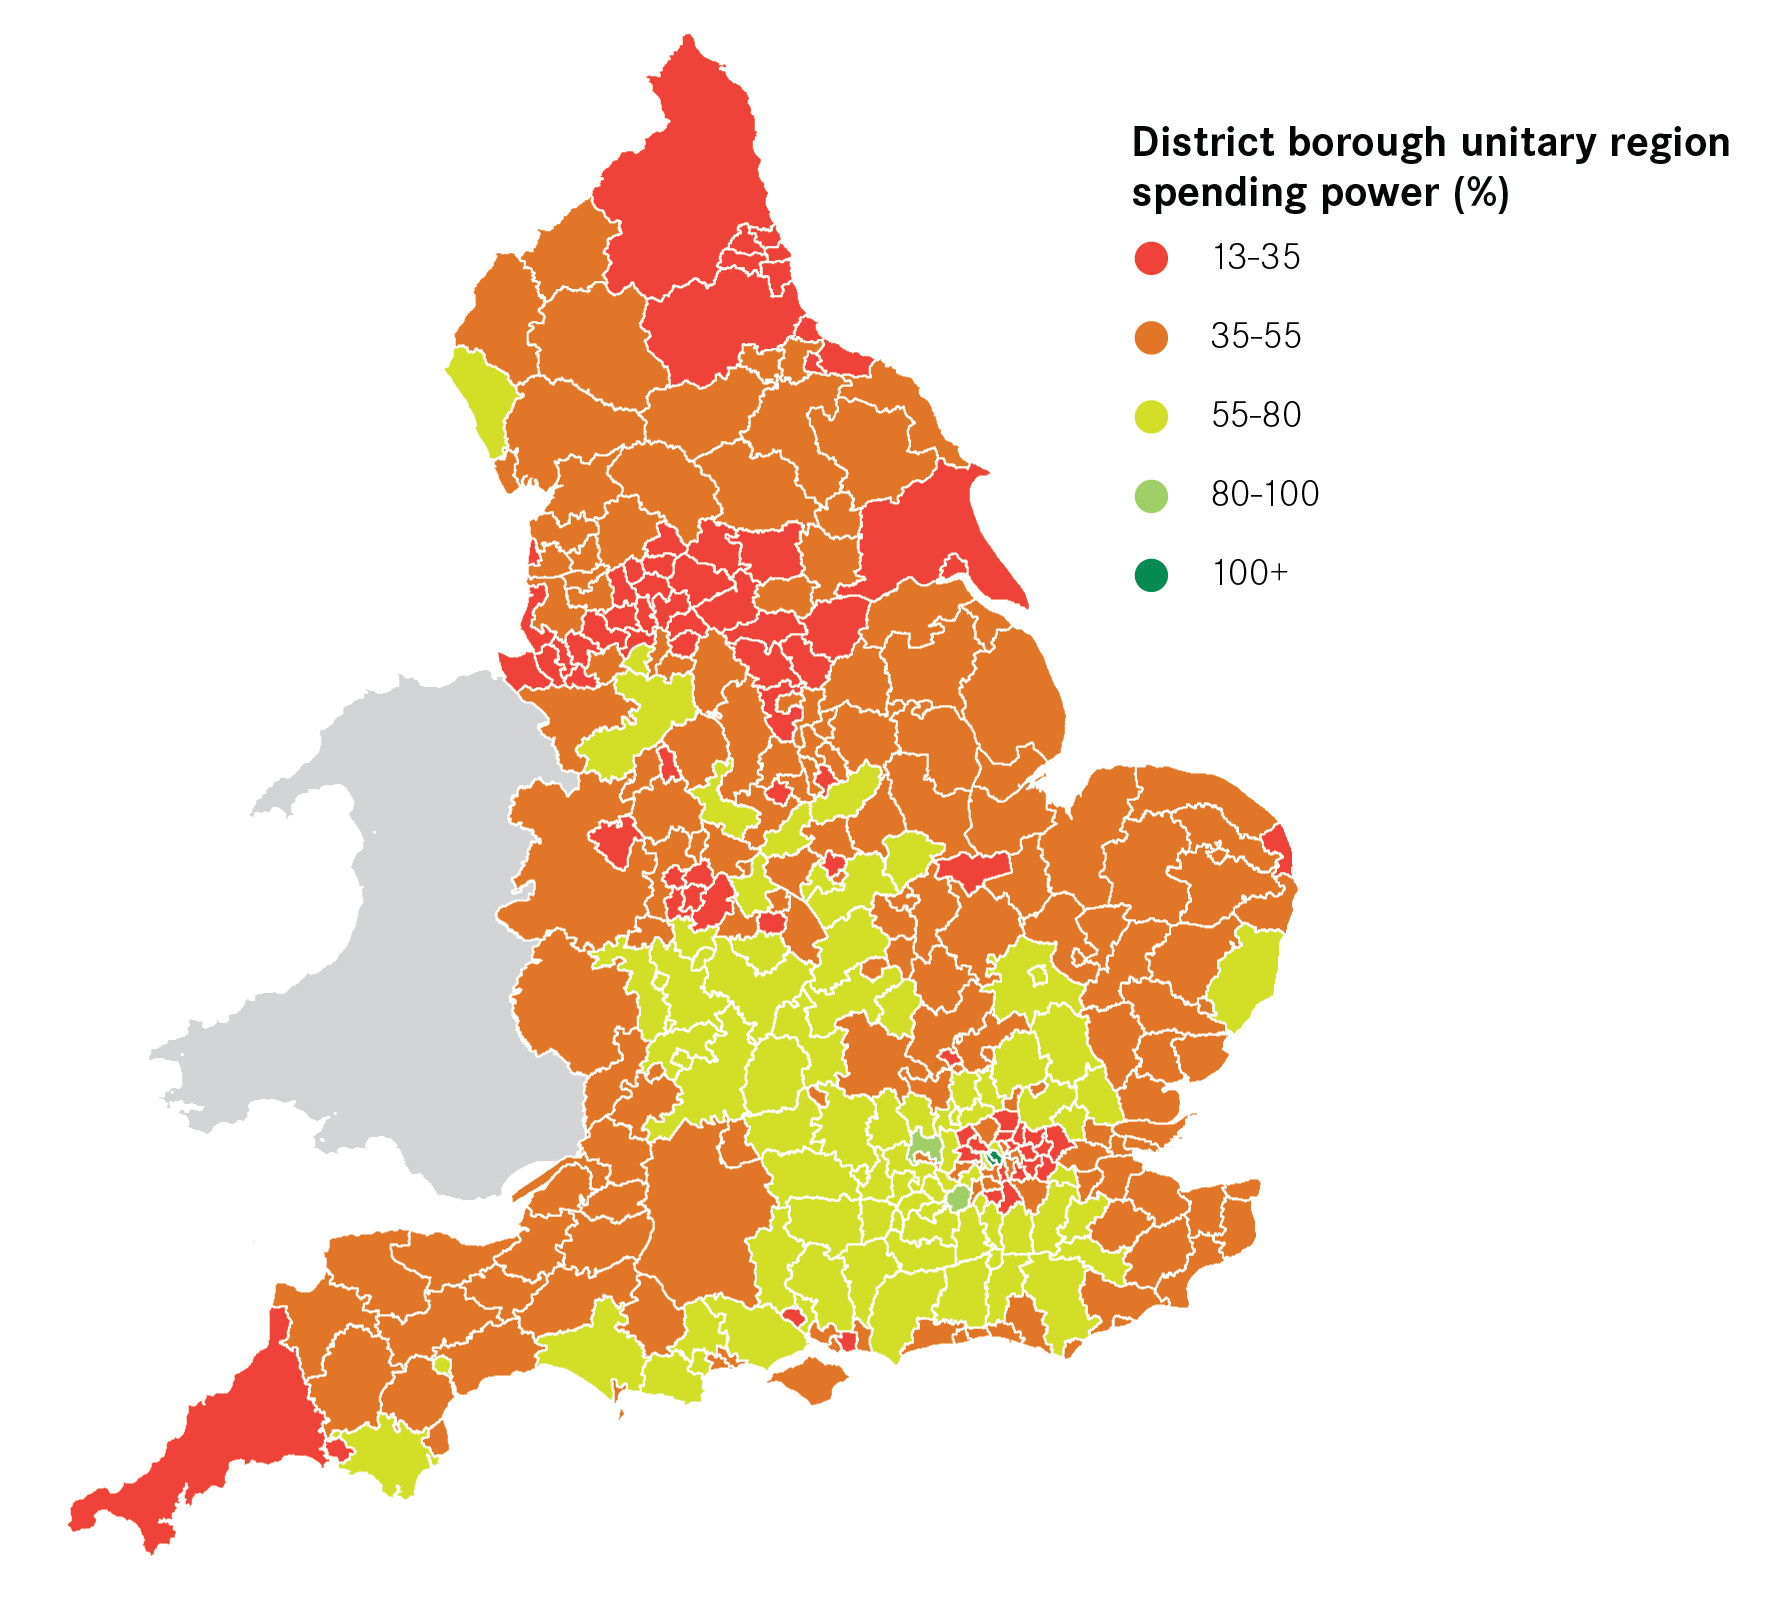
Devolving land and property taxes would give local authorities between 13 per cent and 90 per cent control over the equivalent public expenditure in that locality. City of London, Westminster and Kensington and Chelsea local authorities are outliers, where more land and property tax was generated than was spent by local government.
Figure 7: Land and property tax revenue as a share of local spend
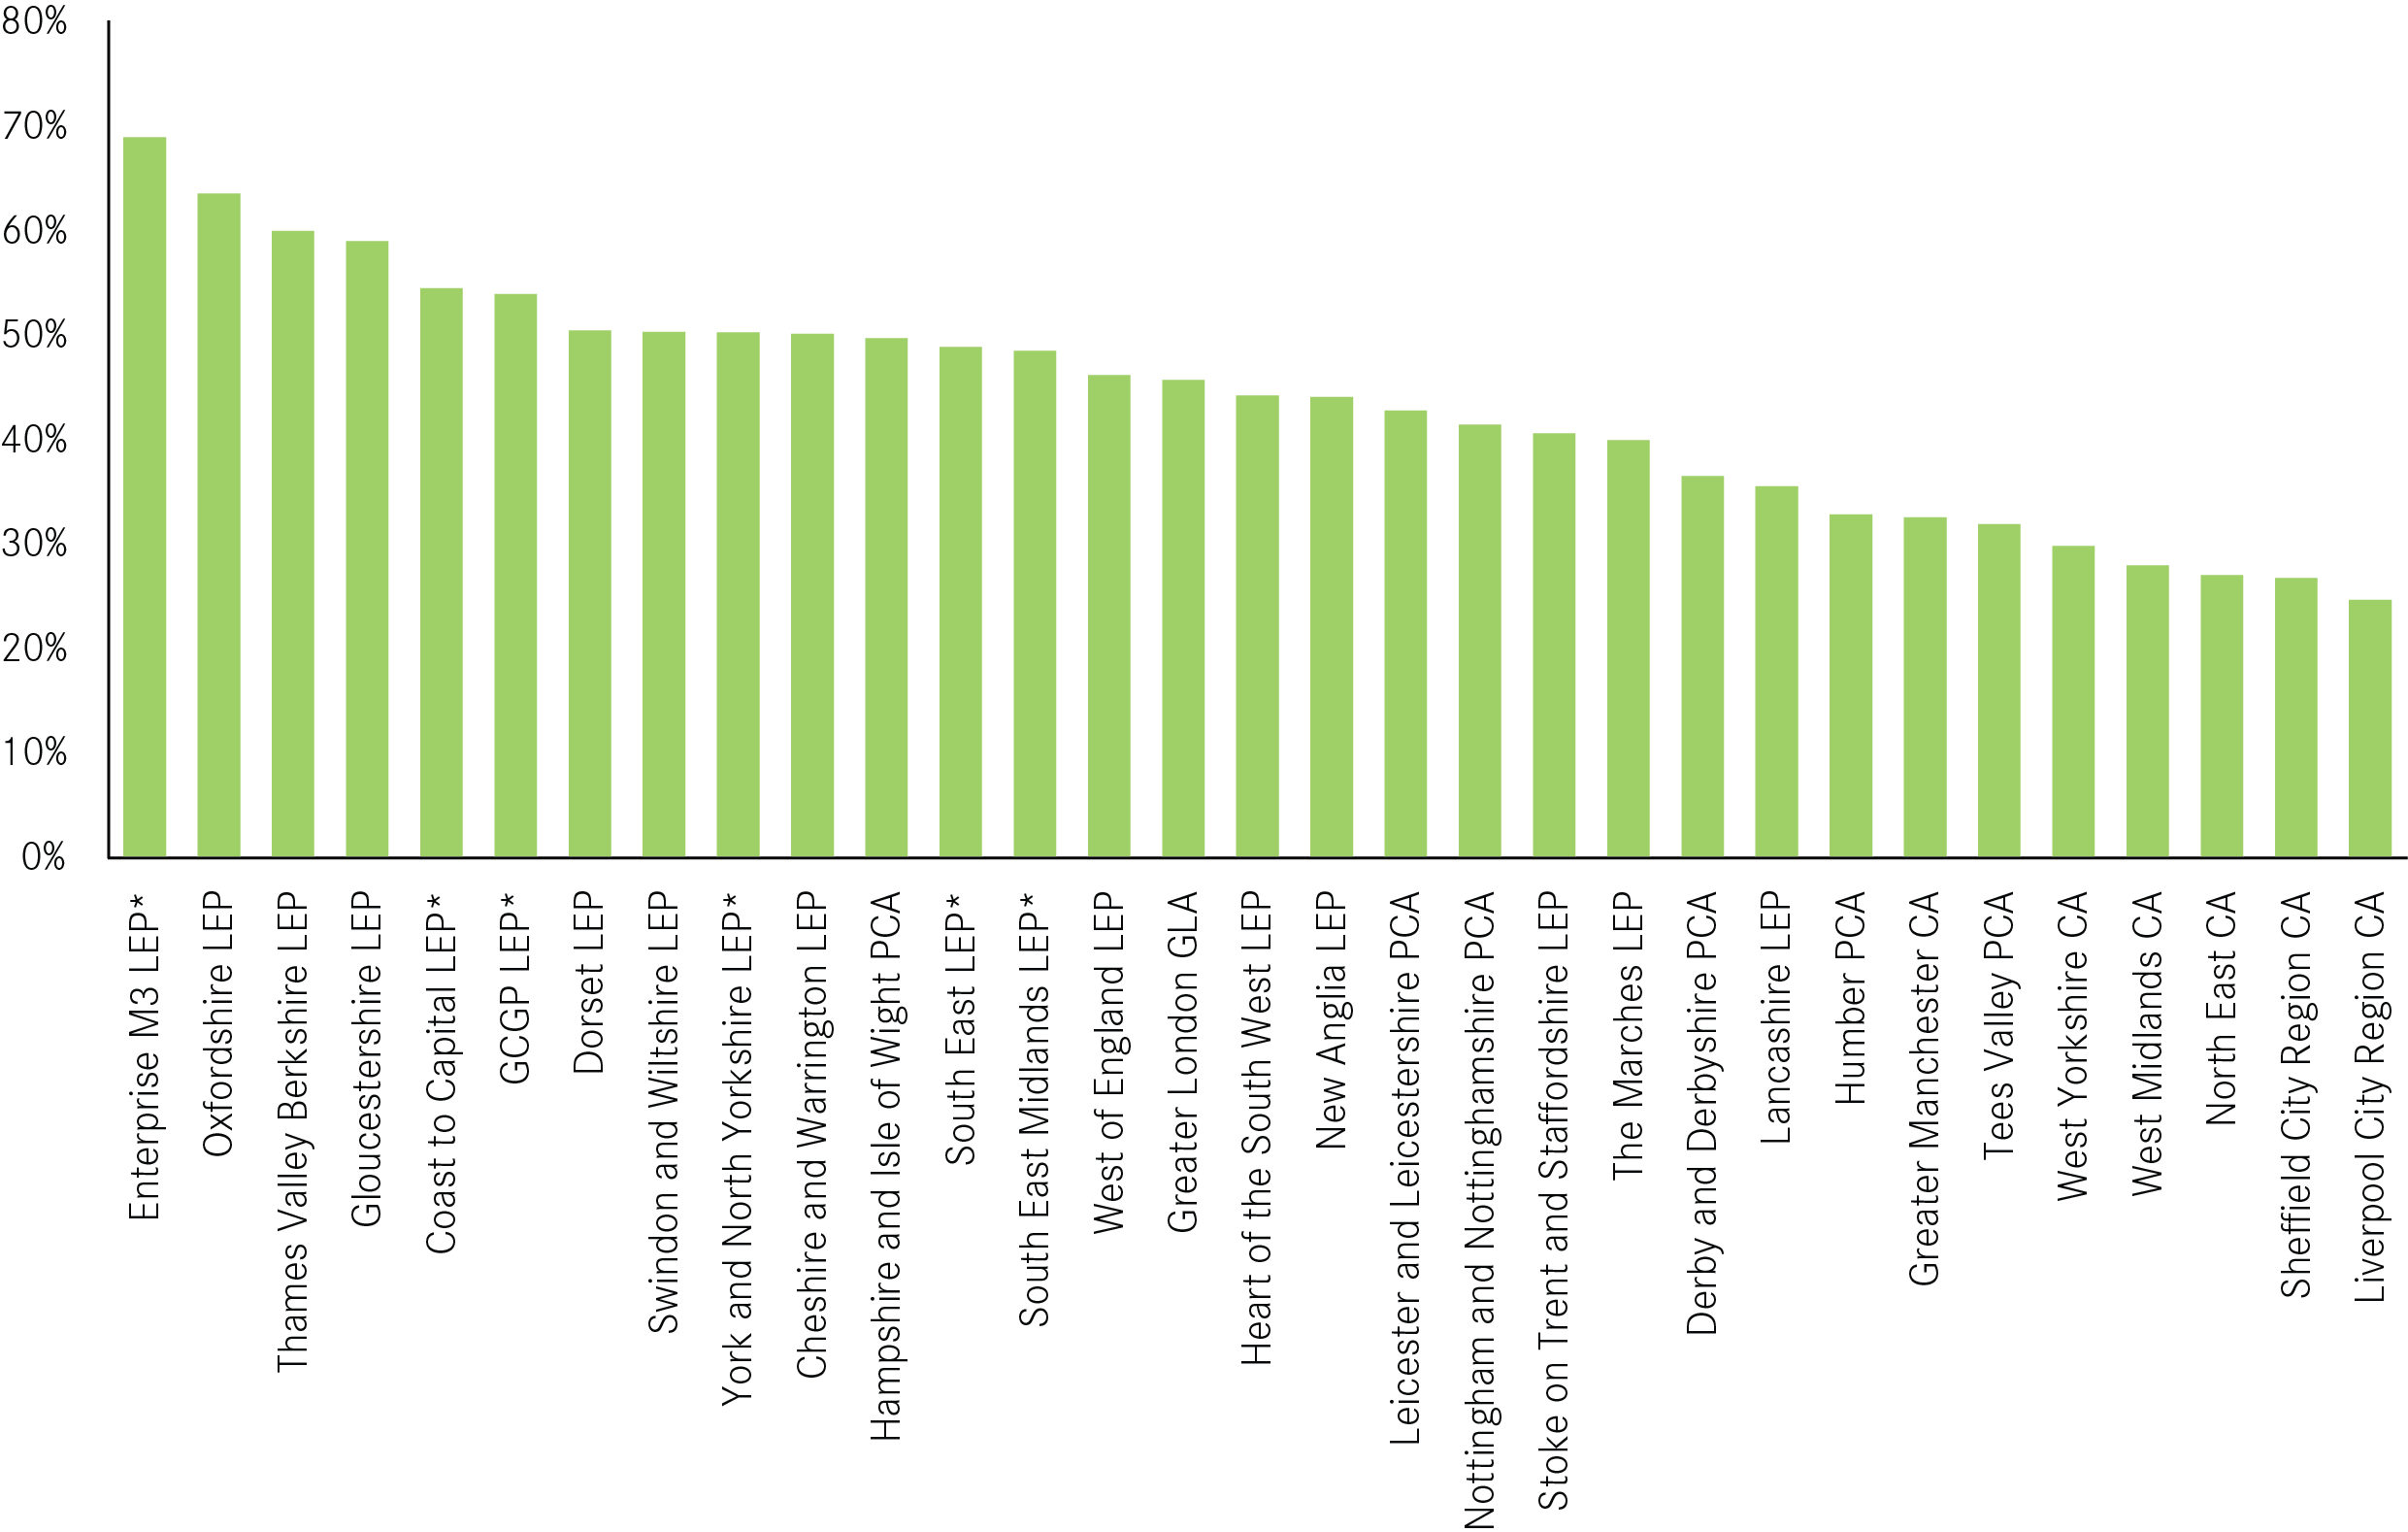
Looking at city-regions, land and property taxes (including sales, fees and charges) would cover the equivalent of between 25 per cent (Liverpool City Region), and 69 per cent (Enterprise M3 LEP) of what is spent by local government.
Figure 8: Land and property tax revenue as a share of local spend by city-region, 2014-15
Devolving land and property taxes would provide an incentive for all localities to support local growth and housebuilding, but particularly in high growth and high demand cities. This is the case in Oxfordshire LEP, which the following example explores in more detail.
Stamp duty devolution in Oxfordshire: illustrating the ‘size of the prize’
Oxford is the least affordable city in Britain. Average house prices are 14.9 times the average wage.33 This affects both existing residents and potential new residents’ ability to live in the area, which in turn poses a risk to economic growth in the long-term.
In recognition of this challenge, Oxfordshire LEP’s programme for growth includes plans to build between 93,560 and 106,560 new homes by 2031 (between 5,848 and 6,660 per year).34 By contrast, only 1,630 new dwellings were completed (across all tenures) in Oxfordshire LEP this year.35
Despite ambitious plans for growth, there are too few incentives for Oxfordshire local authorities to encourage and support housebuilding at the scale that is required to meet demand.
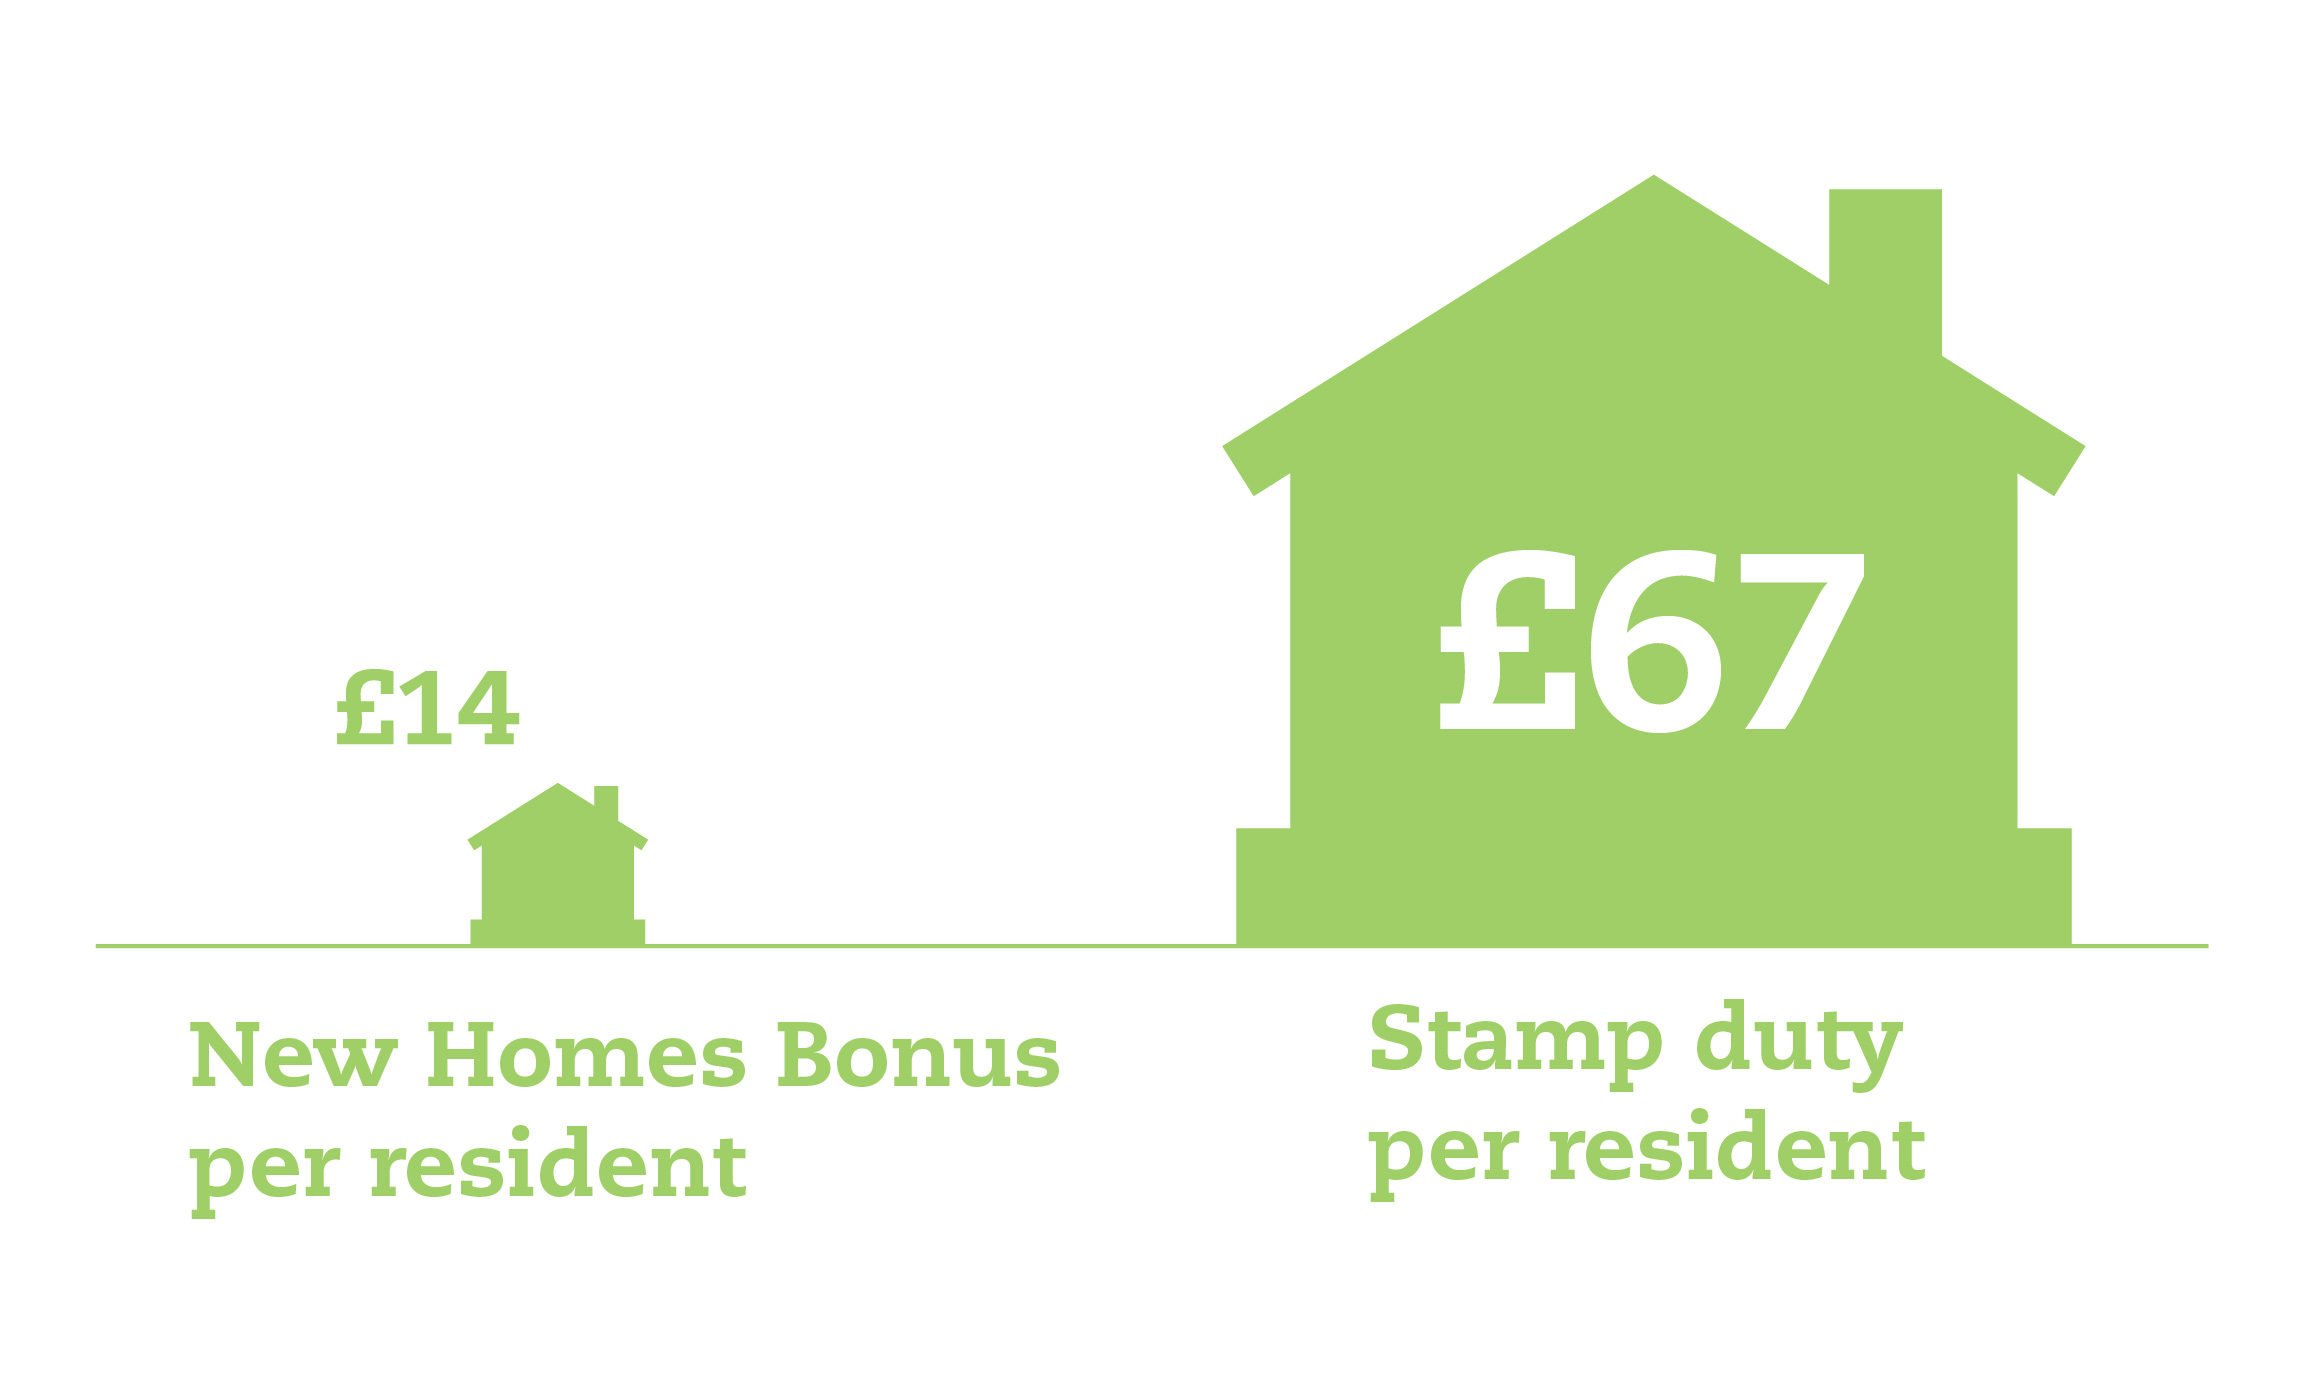
Under the current system, the primary incentive for local government to support the development of new homes is through the New Homes Bonus, which in 2014-15 totalled £9.5 million across the LEP area, equivalent to £14 per resident.36
Devolution of stamp duty revenues would significantly strengthen the financial incentive to permit more development in the area.
In 2014-15, the total revenue from stamp duty in Oxfordshire LEP was £187 million, £138 million of which came from residential property transactions. This is the equivalent of £278 per Oxfordshire resident.37
If Oxfordshire LEP delivers its housebuilding target between now and 2031, this will generate £707 million and £805 million in total, or between £44 million and £50 million per year, in stamp duty on new build sales alone.38 This works out at between £66 and £75 per resident – much more than the current £14 equivalent per resident in New Homes Bonus.
Figure 9: New build incentives in Oxfordshire
50 per cent retention would see the area keeping an additional £353 to £403 million over the 16 year period – the equivalent of £33 to £37 per person per year, with another £365 to £415 million redistributed to other local authorities.
2. Encouraging pooling
The scale and geography to which taxes are devolved is also important. Around half of all workers in Britain live in one local authority but work in another, meaning that these workers generate tax in one authority, but consume public services in another.39 This is reflected in the local tax base of different local authorities within city-regions, with residential areas more heavily reliant on council tax while business rates make up a higher share of the tax take in core urban areas.
Fiscal devolution in the form outlined in this report will enhance the ability of places to work together, rather than encourage localities in the same city-region to compete for the same tax revenues. Places need to be encouraged to increase the taxes they are ‘good’ at generating and should not be penalised by a system that only rewards business growth.
For example, it would not make sense for a predominantly residential local authority with a strong council tax base to chase the business rates revenues of the local authority in which most of its residents work, or to compete with the city centre of the city-region by building out of town shopping centres or business parks.
The following example of the distribution of land and property taxes in Greater Manchester illustrates why pooling tax revenues at the city-region level makes sense.
Land and property tax devolution in Greater Manchester: role and relationships within city-regions
A total of £2.3 billion in land and property tax revenues was generated in Greater Manchester in 2014-15. Manchester local authority accounted for the highest level of all land and property taxes (£546 million) as well as the highest levels of business rates generated (£325 million) and stamp duty (£84 million). Stockport accounted for the highest levels of council tax (£141 million). This reflects the high number of property transactions: 9,873 in Manchester compared to an average 4,402 in other Greater Manchester local authorities.40
Figure 10: Land and property taxes raised in Greater Manchester, 2014-15
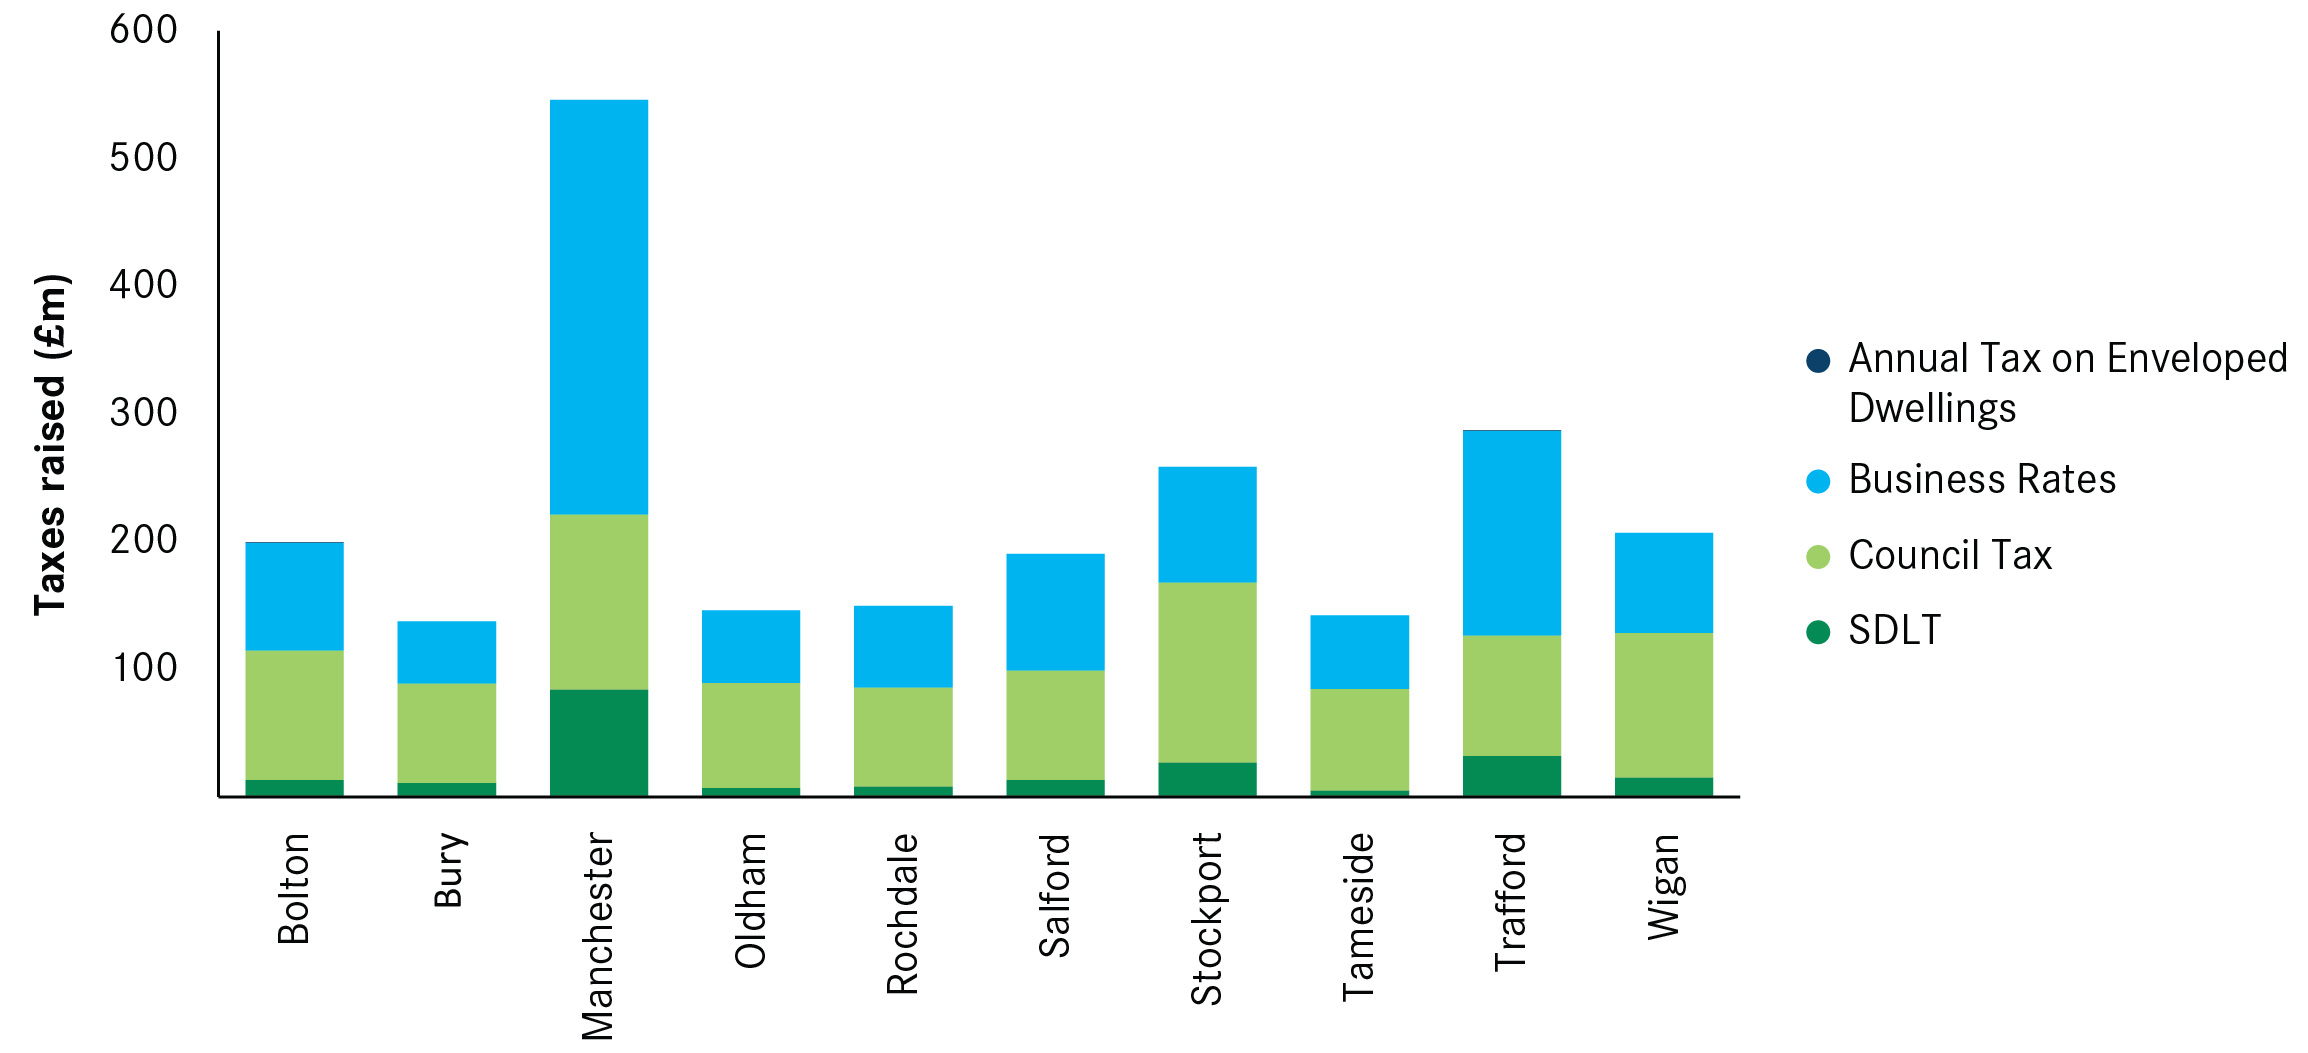
Figure 11: Share of land and property tax revenue by local authority in Greater Manchester, 2014-15 (%)

The pattern of tax revenue generation in Greater Manchester illustrates the need for devolved taxes to be pooled at the city-region scale. Business rates made up the biggest share of the total tax take in Manchester and Trafford local authorities, while council tax drove tax generation in the remaining authorities. This reflects the nature and role of Manchester local authority within the city-region, as a centre for jobs and economic activity. For example, Stockport should not be penalised for being a largely residential area (and therefore generating less in business rates), nor should it be incentivised to try and attract jobs away from Manchester city centre (in order to generate more business tax).
3. New responsibilities: improving incentives not just control
It is safe to assume that devolution of additional tax revenue streams will come with additional responsibilities for local government.
Any system needs to align taxes and expenditure with control over delivery in order to create ‘virtuous cycles’ and incentivise behaviour that can both improve public services (and reduce inefficient spending) and boost economic growth (and in turn increase tax revenues).
Additional devolved responsibilities should consider how to create a link between the way local government is able to deliver any additional responsibilities, and the rewards on offer from achieving positive outcomes (such as increased revenues or savings from more efficient public spending).
Housing benefit bill devolution in London: aligning local tax and spend
Residential development in and around London fails to meet high demand for housing from existing and potential residents who want to take advantage of the jobs and amenities the city has to offer.
The total housing benefit bill in England was £21.5 billion in 2014-15. It has risen in recent years, driven by a decrease in the provision of publicly built housing, along with an increase in the price of private sector rents and the number of renters.41 Rising rents reflects rising property prices in high demand areas such as London and the South East. In London, the housing benefit bill was £6.2 billion in 2014-15, or an average of £732 per resident.42 Meanwhile, £4.3 billion was generated in stamp duty, with £6.8 billion in business rates, £3.5 billion in council tax and £98 million in ATED in 2014-15, a total of £14.6 billion in land and property taxes overall.
In the current system, the increase in council tax and New Homes Bonus from building more homes provides a relatively weak incentive to build more homes when combined with the political disincentives for doing so.
Under the new system proposed in this report, devolving land and property taxes to Greater London would significantly improve the incentive to build more homes. London local authorities would gain more income through the tax revenues from council tax, stamp duty and the New Homes Bonus, and would reduce expenditures through a lower housing benefit bill.
Figure 12: Incentives and rewards: Local housing benefit bill driven by high housing costs and lack of supply
