
043. Are cities bound by these pathways?
While there is a natural reinforcing nature to the two stylised pathways, there are a number of cities that have not followed them consistently over the last century. This section investigates these cities in more detail.
City growth is not deterministic or linear
If the basic challenge for cities over the last 100 years has been to replace jobs in declining industries with those in new, more knowledge-focused, areas of activity, then the scale of the challenge is dependent on the size of the decline. And some cities have seen much larger and more dramatic declines than others.
Manchester is a good example of this. The city has lost around 400,000 jobs in manufacturing over the last 100 years. This has meant that even with the creation of jobs in new areas, the process of reinvention has not been able to keep pace with the speed of decline in more traditional areas of employment. The result is that today Manchester has 1 per cent fewer jobs than a century ago.
But the problem that Manchester has faced is not that it hasn’t been able to attract knowledge-focused businesses, but that it hasn’t, as yet, generated enough of these jobs to offset losses in more traditional industries. Since 1991, Manchester has seen jobs growth of 24 per cent, the majority of which have been in more knowledge-focused activities. So while the city has fewer jobs than it did a century ago, it appears to have passed through a turning point. Box 6 discusses Manchester in more detail.

Case study 1: A century of change in Manchester
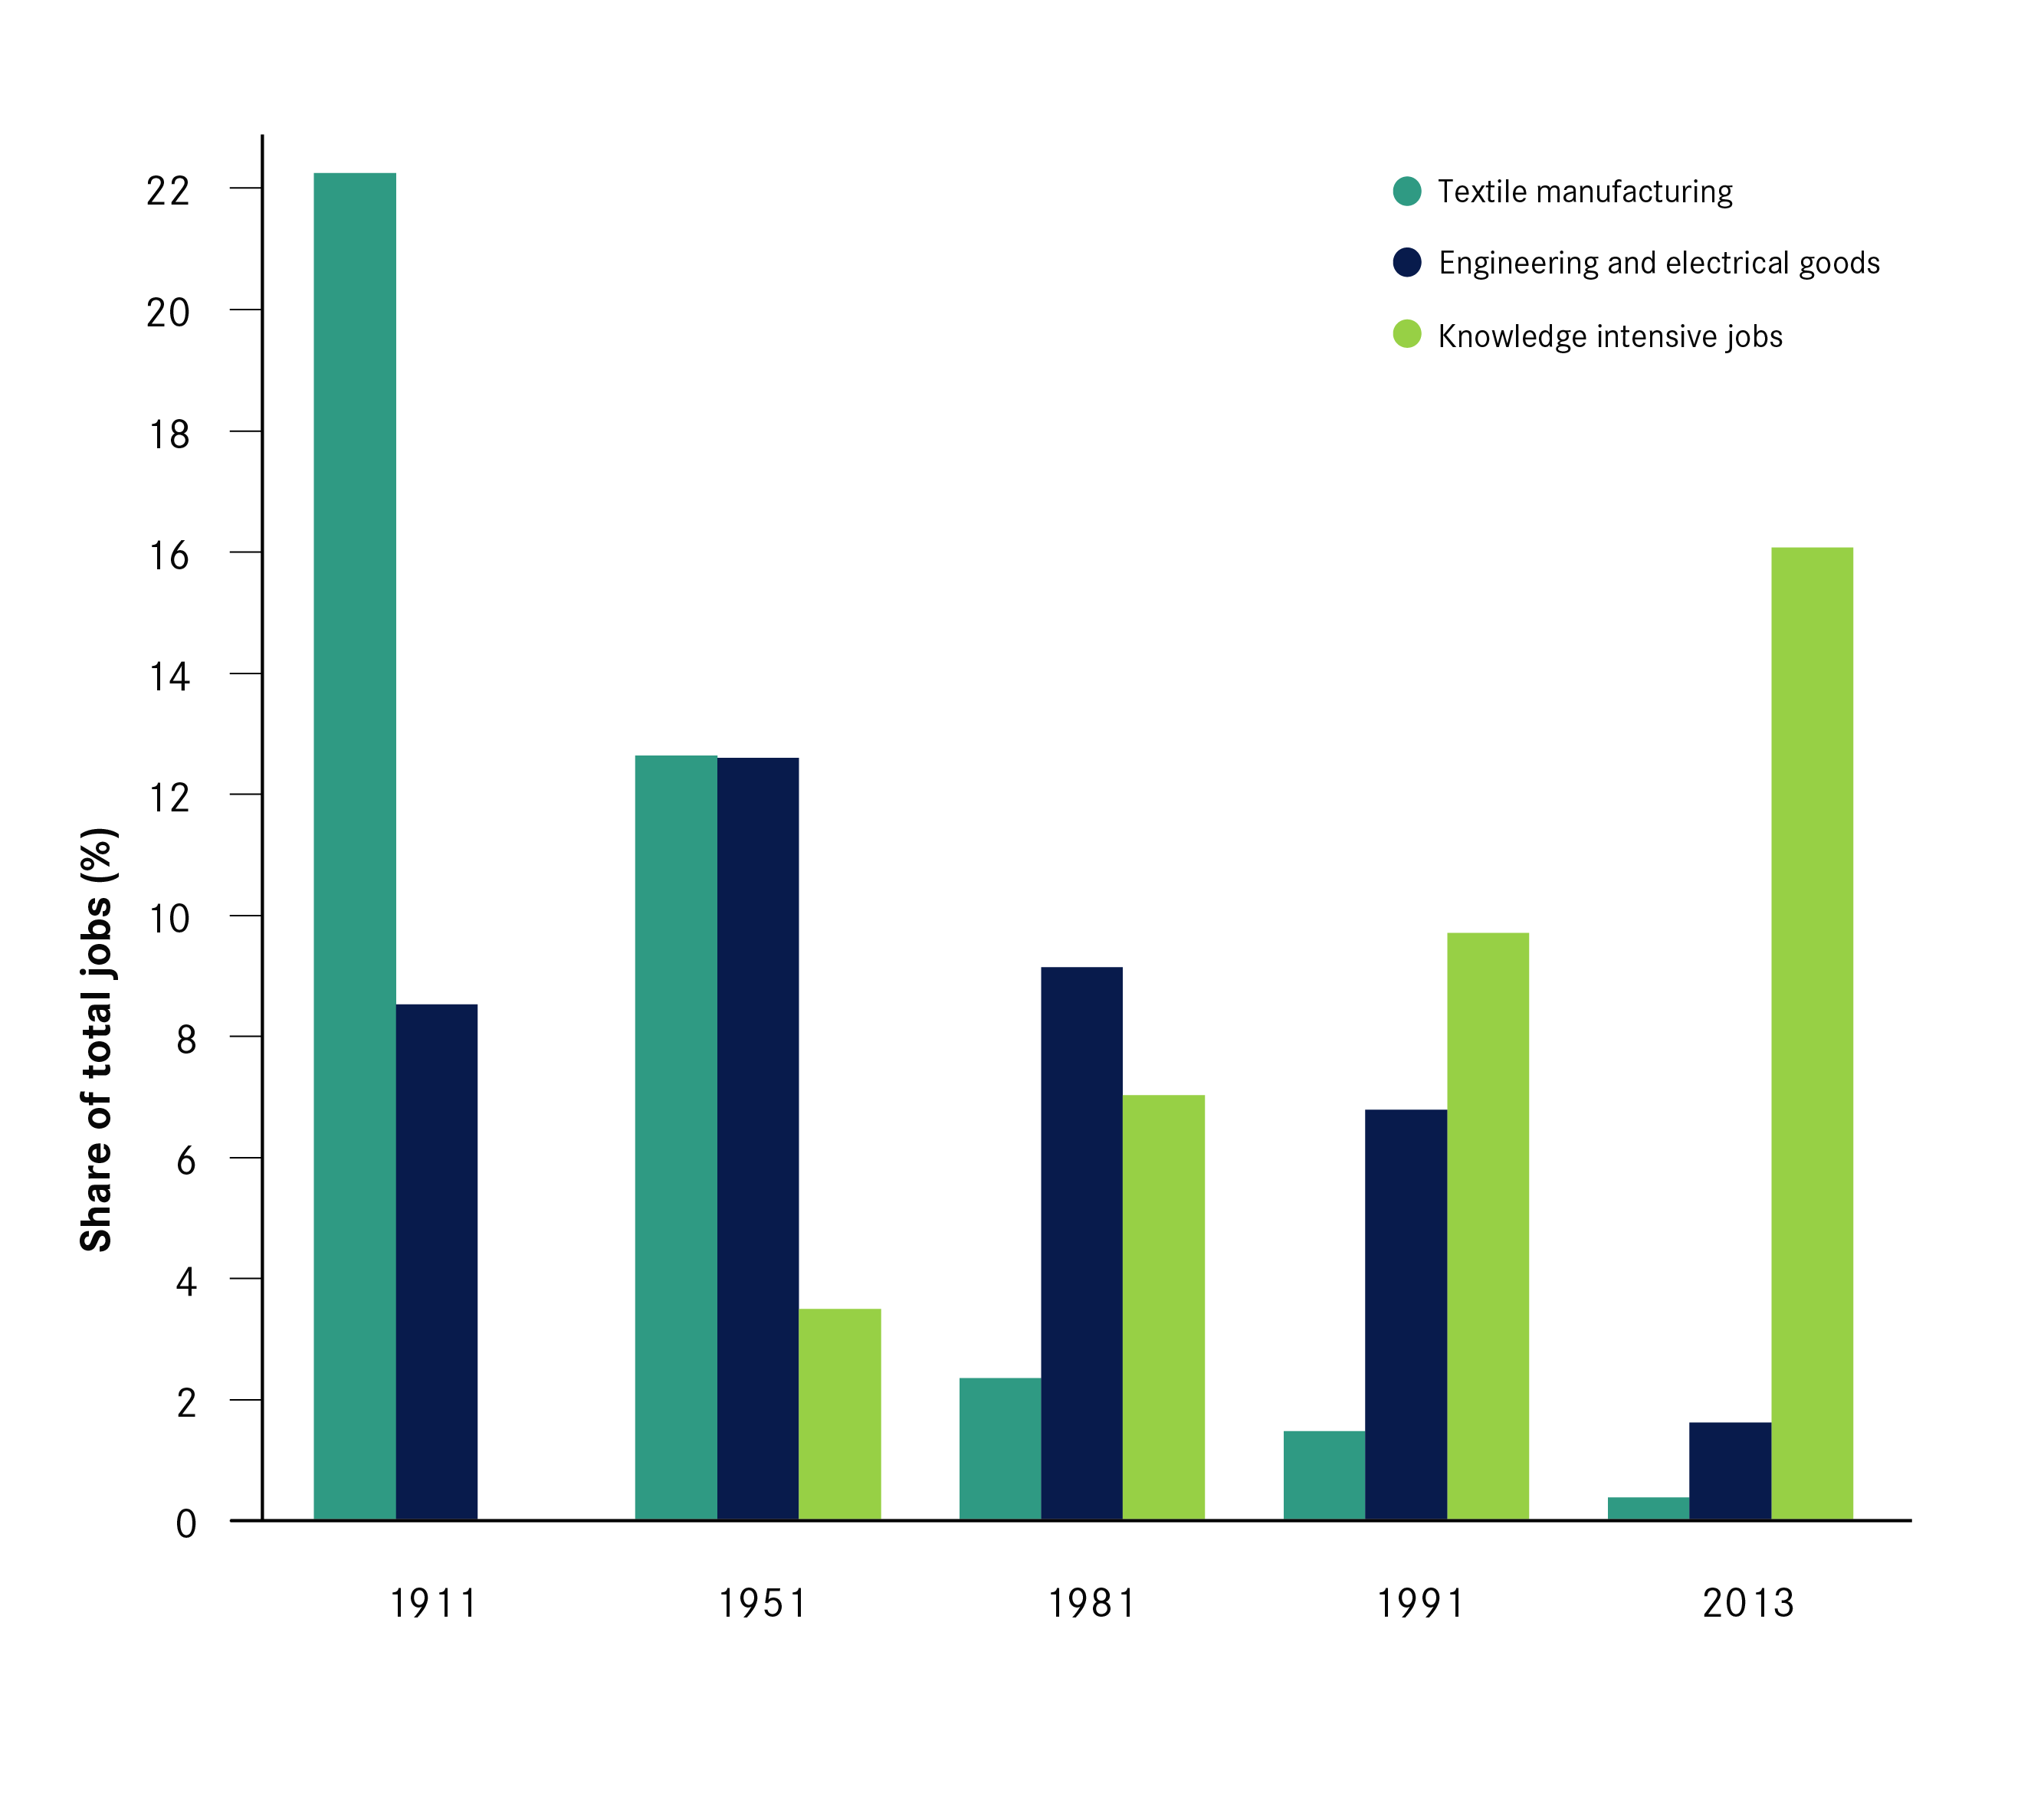
During the 19th century, the city of Manchester was a major cotton producer and trade centre, well connected on the river Mersey, and supported by its Victorian port, railways and canals. Dubbed “cottonopolis”, Manchester and its surrounding Lancashire mill towns were responsible for the spinning of 32 per cent of global cotton production in the late 19th century.23 In 1911, 22 per cent of the city’s jobs were in textiles. Textile production also supported a logistics industry associated with the movement of goods, which in 1911 employed over 8 per cent of all workers.
Textiles and logistics, as Manchester’s key drivers of growth, began to falter during the interwar period, as a result of the Great Depression and growing competition from international trade. Although the city had around 80,000 more jobs in 1951 than in 1911, there were 90,000 fewer in textiles and logistics. These losses were offset by growth in chemical and electrical engineering. There was a 60 per cent increase in jobs in engineering and electrical goods between 1911 and 1951, and by 1951, this sector employed around the same proportion of workers as the textiles industry. Firms such as the Westinghouse Electrical Corporation and the Ford Motor Company in particular contributed to growth in this area.24
This diversification into new manufacturing industries did not last, however, and the 30 years after the war were disastrous for Manchester. Overall jobs declined by 22 per cent between 1951 and 1981; jobs in engineering and electrical goods nearly halved, and jobs in the textile industry declined by 86 per cent. By 1981, it was a city in desperate need of change.
The city’s response to this post-industrial decline was highly proactive. The Central Manchester Development Corporation was created in 1988 in order to redevelop the city centre, converting neglected buildings into offices and building new offices to allow businesses to thrive, and improving the public realm.25 These changes enabled the city to support a knowledge network, which alongside a period of strong national economic growth during the 1990s, helped in the creation of jobs, particularly in KIBS. Some small growth was seen during the 1990s, with 2 per cent growth in total jobs between 1991 and 1998, as new KIBS jobs in insurance and finance started to locate in Manchester.
The reaction to the IRA bombing in the city has also helped shape its recent history. The 1996 disaster devastated a large area of the city centre, but also prompted a massive regeneration project. A city centre masterplan created a new mixed-use space with leisure and cultural activities as well as offices,26 while many warehouses, relics from Manchester’s distribution history, were converted into city centre residences during the 1990s.27 Further developments such as Spinningfields have attracted the regional offices of companies such as The Royal Bank of Scotland and Barclays.28
The result is that Manchester is now experiencing a process of reinvention, having seen a 24 per cent growth in jobs between 1991 and 2013, including 77,000 more jobs in private sector knowledge-intensive service industries. It also had the second fastest growing city centre of all British cities between 1998 and 2008, driven by growth in KIBS.29
The scale of the deindustrialisation challenge was such that the city still has some way to go; in 2013 Manchester still had 90,000 fewer jobs than it did in 1951. However, its recent successes suggest that it is on a new pathway of knowledge-based economic growth.
Figure 13: Manchester’s changing industrial structure
The decline and growth of Manchester offers an interesting insight into Birmingham, categorised as a replicator in Figure 5. Birmingham both grew much faster than Manchester during the interwar period and was not hit as hard during the post-war decline. But while it has grown since 1981 – it had 2 per cent more jobs in 2013 than it did three decades earlier – this growth has been propped up by the public sector. By 2013 it had over 90,000 fewer private sector jobs than it did in 1981.
But there are signs that Birmingham may too have reached a turning point. Like Manchester, Birmingham’s city centre has seen very strong jobs growth in recent years, driven by knowledge-intensive business services.30 The current problem is that the growth of jobs in its core has not been large enough to offset the decline of more traditional jobs in the city. This suggests that Birmingham’s economy is also going through a process of reinvention, but it continues to grapple with a large industrial hangover. Box 7 discusses Birmingham in more detail.

Case study 2: A century of change in Birmingham
In 1911, half of Birmingham’s jobs were in manufacturing. Known as the “city of a thousand trades”, which no doubt reflected its entrepreneurial dynamism, a large share of its jobs in 1911 were in tools, dies, arms and other miscellaneous metal industries.
During the 20th century, the coming of the motor car enabled the city to capitalise on their history in metal manufacture and take the lion’s share of the national motor industry. The city saw its population grow by 39 per cent between 1911 and 1951, while its jobs increased by nearly 50 per cent. By 1951, the vehicle industry, which had barely existed in 1911, made up around 12 per cent of Birmingham’s jobs. The city also produced aircraft, and during the Second World War, the Castle Bromwich Aircraft Factory was the largest Spitfire factory in the UK.31
Although Birmingham grew during the first half of the 20th century, its reliance on low-knowledge manufacturing industries was also deepened. The low skills of the labour force, already negatively affected by the historical division of labour in Birmingham’s manufacturing, were intensified by the replacement of Birmingham’s numerous small manufacturers by large firms,32 and by ‘knowledge-destroying’33 assembly line manufacturing of vehicles.34 This was seen in firms such as the Austin Motor Company, which employed 18,500 people in 1948.35 This increasingly routinised nature of work affected the growth of knowledge-intensive service jobs in Birmingham. Although total jobs in Birmingham nearly doubled between 1911 and 1951, less than 3 per cent of jobs where in knowledge-intensive services in the middle of the century.
The city’s expansion up to 1951 sharply reversed in the next three decades. Total jobs had fallen by 9 per cent by 1981, including the loss of around 40,000 jobs in vehicle manufacturing, symbolised by the decline of companies such as British Leyland.36 While globalisation squeezed the city’s traditional manufacturing base,37 policy also had a hand in this decline – concerned about the size and success of Birmingham, the Distribution of Industry Act and the ‘Brown Ban’ attempted to shift industrial and office activity away from the city to other parts of the country.38 Despite these interventions, however, Birmingham’s growing knowledge base still saw around 30,000 additional KIBS jobs created between 1951 and 1981.
More recently, this growing knowledge sector has been supported, rather than held back by policy. From the 1980s, policy has focused on improving the performance of Birmingham’s city centre. A series of initiatives, such as the building of the International Convention Centre,39 and the Highbury initiative, a symposium which sought to improve the city centre’s connectivity and accessibility and led to the breaking of the ring road or “concrete collar” to the city centre, have been implemented.40
Despite these improvements, Birmingham has still struggled to respond to de-industrialisation. The city’s private sector had around 93,000 fewer private sector jobs in 2013 than in 1981, and 300,000 fewer jobs in manufacturing.
However, building on the steady growth of KIBS, and supported by a strong city centre, the number of KIBS jobs in the city has nearly doubled since 1981. Driven by KIBS jobs, between 1998 and 2011, the city centre saw private sector jobs growth of 17 per cent.41 Birmingham now attracts 40 per cent of the national conference trade, is Europe’s second largest insurance market, and has over 500 law firms.42 The strong growth of knowledge-intensive services jobs in its city centre suggests that the city has passed through a turning point and is now better placed to grow in the coming decades.
Figure 14: Birmingham’s changing industrial structure

Public policy has played a role
As set out earlier, globalisation and technological advancement have been the two drivers of change over the last 100 years. But policy has also had a role to play. There are two policy interventions that, without having an explicit regional focus, have had a large influence on job creation in cities. The first is the new towns policy in the 1940s, 50s and 60s. And the second is the expansion of the welfare state, and the jobs that resulted, after 1945.
The new towns initiative was mainly designed to ease pressure on London, with a number of existing settlements around the capital – such as Crawley, the fastest growing city of the last 100 years, and Peterborough – designated for growth. Crawley and Peterborough have benefited from a great deal of infrastructure investment through their new town designation, while they both have had very small industrial legacies to deal with. The large infrastructure investment in both places is likely to have increased their attractiveness as places to do business.
The most extreme examples of new towns without an industrial legacy are the ones that were built from scratch, including Milton Keynes and Telford. Neither had any industrial legacy to deal with, and so the challenge for these cities has been to invent, rather than reinvent, their economies. Box 8 discusses the development of both cities in more detail.
Case study 3: The blank slates – Milton Keynes and Telford
Milton Keynes and Telford were created during the third wave of new towns in the 1960s,43 and so do not feature in this study. But their performance since their creation is interesting to compare against that of more established cities.
Both in terms of employment and GVA they have been the fastest growing cities in Britain since 1981.44 This growth has meant that, by 2013, Telford was home to 79,000 jobs, while Milton Keynes had over 150,000.
The benefit that both cities have enjoyed is the absence of an industrial legacy to deal with, so the challenge for these places was not to offset the decline of more traditional industries with jobs growth in new areas, but to create new jobs.
Interestingly, despite both starting with a clean slate upon their formation, this job creation occurred in different sectors in the two cities. Today Milton Keynes’ economy is much more knowledge-focused that Telford’s – over one in five jobs in Milton Keynes is in KIBS, while in Telford it is around one in 10. And Telford has the third highest share of manufacturing jobs of all cities in Britain, while Milton Keynes ranks 48th.
While both have seen fast-paced growth in recent decades, the question is whether both will be able to sustain this growth in the future. Given the more knowledge-focused economy that Milton Keynes has developed, the trends explored in this paper would suggest that it is in a better position to sustain its strong growth than its new town cousin.
The expansion of the state after the Second World War and the subsequent creation of public sector jobs has also had a big impact in many cities. For cities such as London these jobs have complimented the growth of jobs in the private sector – of the 1.8 million increase in jobs in the city over the last 100 years, around 900,000 have been in public administration, defence, health and education. In other cities, such as Liverpool – the public sector has played a very different role, softening its decline. There are 41,000 fewer jobs in the city today than in 1911. But without the expansion of public sector jobs this would have been much worse – the private sector has an estimated 141,000 fewer jobs than it did 100 years ago.
The impact that this has had on the ability of a city to reinvent itself depends on the type of jobs created. Research-based hospitals and universities are likely to have increased the stock of knowledge in an economy. But the relocation of lower-skilled public administration jobs, such as HM Revenue and Customs jobs to Liverpool and Department of Work and Pensions jobs to Newcastle, while no doubt welcome, are likely to have reinforced replication. In this vein it will be interesting to see what impact the relocation of parts of the BBC to Salford will have on the Manchester economy in the coming years.
Policies explicitly designed to close the ‘North-South divide’ have not fostered reinvention
Figure 15: 80 years of policy attempting to rebalance the economy
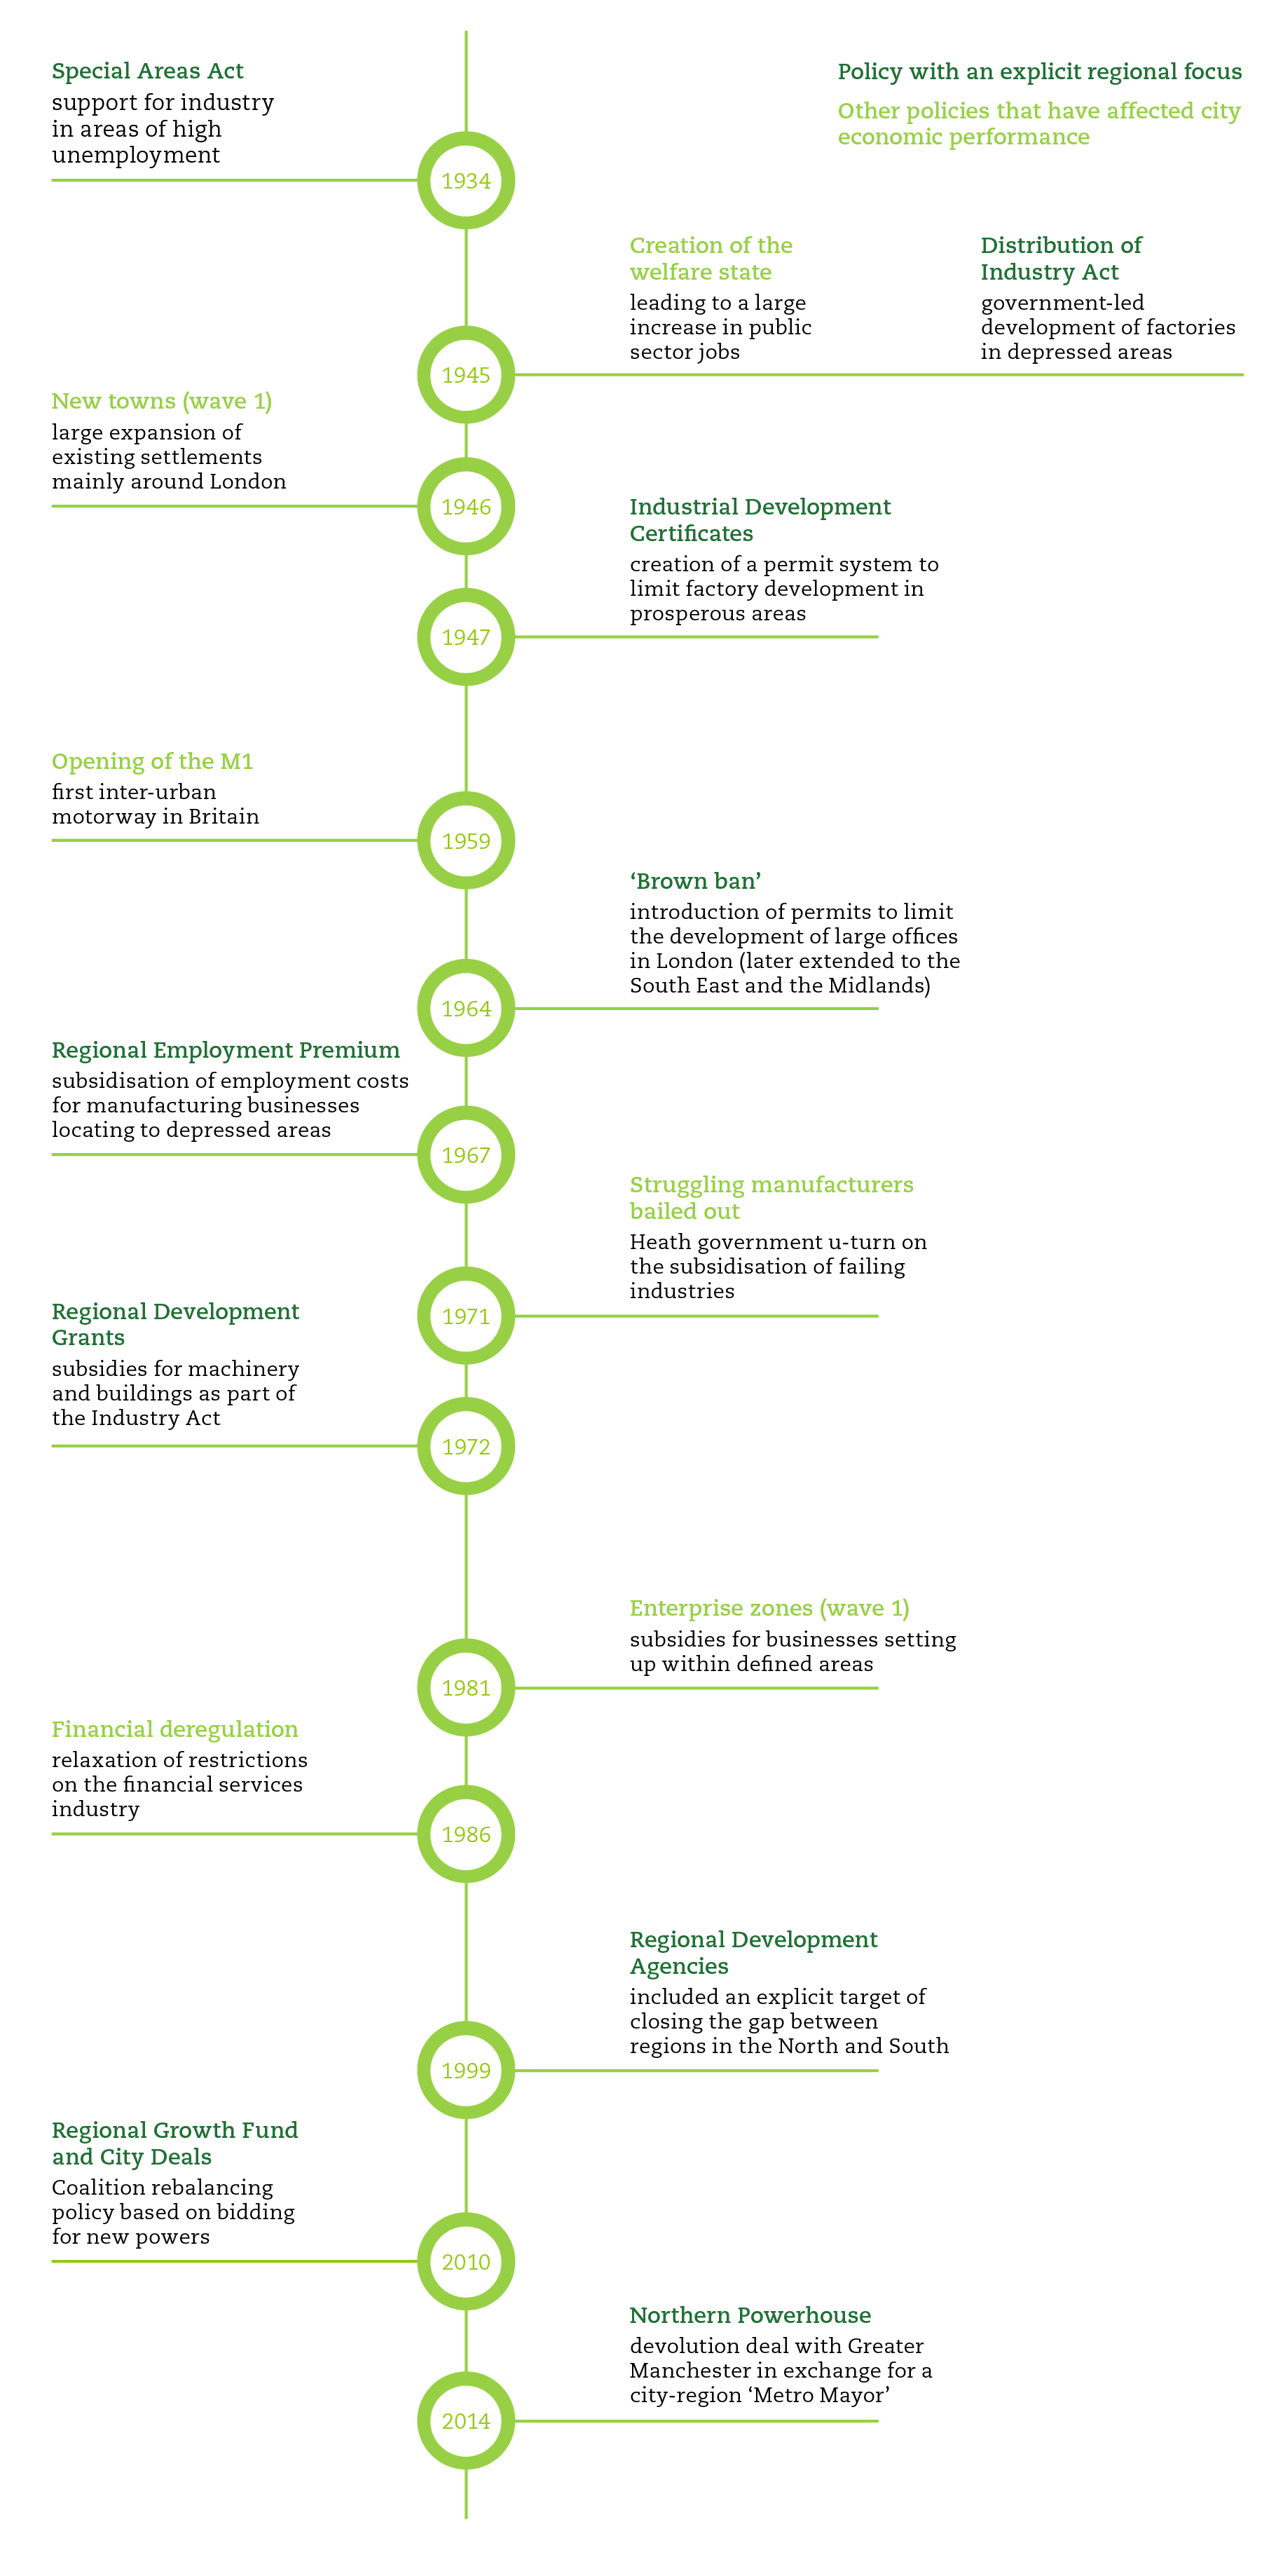
The expansion in the number of public sector jobs and the new towns policy have not, for the most part, explicitly attempted to redistribute economic activity around the country, but have nevertheless had an impact on where jobs are located. There has been another subset of policies that have explicitly attempted to boost growth in places that are struggling economically, as shown in Figure 15. But these policies have had little positive impact because, in many cases, they have reinforced replication rather than encouraged reinvention.45
Manufacturing, industrial policy and the ‘march of the makers’
As has been set out above, the problem for those cities that have struggled over the last century has not been the inevitable decline of extraction, logistics and manufacturing employment, but rather their inability to support jobs growth in new industries.
But this has not stopped governments of different political colours attempting to either limit the decline in low-skilled manufacturing employment or indeed encourage its expansion in poorly performing cities. Examples of this range from the Special Areas Act of 1934,46 which attempted to encourage industrial growth in areas of high unemployment, through to the current Government’s rhetoric around rebalancing the economy towards manufacturing and the ‘march of the makers’.47
Following on from previous administrations the Coalition has introduced a number of policies that have attempted to boost manufacturing in the North and Midlands. The Regional Growth Fund has been most explicit about this – of the £720 million allocated in the first three rounds of the fund across England, 42 per cent was allocated directly to manufacturers in the North and Midlands. In the North East, 73 per cent of the £114 million allocation to the local enterprise partnership was given to manufacturing.48 Enterprise zones have had a similar focus – of the 16 that are located in the North and Midlands, 15 explicitly cite manufacturing or engineering as their sector focus.49 And a number of the deals struck in Wave 2 of the City Deals programme included an explicit focus on manufacturing and energy, as discussed in Box 9.
Box 6: City Deals Wave 2
City Deals were introduced by the Coalition Government to strike bespoke deals with individual cities to pass down policy powers and freedoms to the cities.
The first eight deals – known as Wave 1 – were struck with England’s Core Cities, and tended to focus on a broad package of interventions around investment vehicles, skills and business support. Wave 2 deals were struck with a further 20 cities. Unlike Wave 1, these deals tended to focus on one specific issue or site rather than offering powers over a wider range of areas.
There was a distinction between the types of deals the cities struck depending on whether they were reinventors or replicators. Of the 20 cities, 13 are classed
as replicators in this paper. Of these 13, 10 had supporting the manufacturing or energy sectors as a central element of their deal.
The City Deals process offered a unique opportunity to cities to tailor policy to help the process of reinvention in their economies. Unfortunately the deals are likely to reinforce replication instead.
These jobs have usually been branded as ‘advanced manufacturing’ – a buzzword in economic development circles – but sadly do not tend to be particularly advanced. There are undoubtedly very high-skilled jobs in UK manufacturing. But these jobs tend to be based in the very cities that have been able to adapt and reinvent their economies, most likely because of the more highly skilled workforces in these cities. As Figure 16 shows, one in five jobs in manufacturing in Quadrant A cities are classed as high-skilled, whereas it’s one in three in Quadrant D cities. As such, these policies have tended to reinforce low levels of knowledge, rather than encourage the creation of new knowledge.
Figure 16: Share of manufacturing jobs that are high-knowledge, 2011


Case study 4: A century of change in Sunderland
Sunderland’s rapid growth through the 19th century was mainly due to the mining and export of coal and shipbuilding, and because of the latter it was known as ‘the largest shipbuilding town in the world’.50 In 1911, around 33 per cent of jobs were in shipyards or collieries.
Both industries did expand through the interwar period, despite the Great Depression, and by 1951 the number of shipbuilding jobs on the Wear had increased by 34 per cent to almost 14,000. This was in part spurred by demand created by the Second World War – the city produced more than a quarter of the nation’s total tonnage of merchant and naval ships during World War Two50, and was supported by public investment in creating a new deep water quay.52
In the decades after the Second World War shipbuilding in Sunderland was increasingly exposed to global competition, particularly from the Far East. This led to a series of yard closures or mergers. In 1977 the shipbuilding industry was nationalised, and in 1980, the last two shipyards in Sunderland merged. This single company lasted only eight more years before its closure brought an end to 600 years of shipbuilding on the Wear.53 In return for the granting of an aid package, the European Commission placed a ban on shipbuilding and repair in Sunderland.54
Mining suffered similar declines. A number of collieries closed across the city after the Second World War. The last closure was Wearmouth Colliery which closed almost 160 years after it opened in 1993. Sunderland AFC’s Stadium of Light now stands on the site.
The decline of both industries was the key driver of the overall job losses seen in Sunderland. By 1989, there were over 17,000 (16 per cent) fewer jobs in the city than in 1951, with mining and shipbuilding seeing a combined loss of around 30,000 posts.
There were a number of policy responses to offset these closures. The first was to convince Nissan to locate its car plant on Wearside over Humberside or Wales.55 The second was to create a number of enterprise zones including Doxford International, which has been particularly popular with call centres. Together Nissan and the call centres are estimated to directly account for around 15 per cent of all jobs in the city today.56
While these interventions have helped the city’s economy to grow again – there were 23,000 more jobs in 2013 than in 1989 – they have encouraged the replication of Sunderland’s economy. New jobs have tended to be in lower-skilled work on out of town sites, and it’s for this reason that 57 per cent of jobs in the city are in lower-skilled jobs, the 2nd highest of all UK cities.57
Recent policy has continued in this vein. Sunderland’s recent city deal centred around the creation of the International Advanced Manufacturing Park on a site neighbouring Nissan. Given the structure of manufacturing in Sunderland (the city has the lowest share of high-skilled jobs in its manufacturing sector out of all cities in England and Wales), it is likely that this policy will also reinforce the past rather than looking to the future.
Grants, inward investment and business relocation
The use of grants and other financial incentives have been another tool used to encourage business relocation. While by no means alone in doing so, this was a popular tool used by the Welsh Development Agency and then by the Welsh Assembly Government.58 The location of Amazon in Swansea is a good example of this – the company received £8.8 million from the Welsh Assembly Government in 2008 to set up a distribution centre in the city, as well as having a new road funded by public investment.59
But as shown above, those businesses that are more cost sensitive, and so are likely to be most attracted by such incentives, are likely to be lower-skilled, more routinised businesses. And so such policies again encourage replication, rather than supporting reinvention.
Subsidisation of business parks
Business parks became an increasing priority in the 1980s, led by the introduction of enterprise zones. At a time of inner-city decline these low-density, out-of-town sites were earmarked as the hi-tech employment sites of the future. All 38 of the first wave of enterprise zones were either in rural areas or on the urban fringe,60 and local authorities and Regional Development Agencies subsidised a number of business and science parks.
These interventions have had three main impacts. Firstly, they incentivised economic activity to spread across a city, rather than concentrate within its centre. Secondly, they incentivised the oversupply of office space in certain areas, pushing rents far below what developers would require to make an investment, which hindered subsequent office development in the city centres of some cities. And thirdly, these parks tended to be attractive to lower-skilled, more routinised businesses such as call centres. The combination of these factors has meant that such interventions have – on the whole – encouraged replication.
Cluster and sector policies
Attempts to create clusters and specific sector support have also been popular policy interventions at both the national and local level in recent years. The creation of TechNorth – designed to encourage a cluster of technology businesses as part of the Coalition’s Northern Futures initiative – is the latest example of this.
Unlike many of the policies above, these policies have aimed to reinvent rather than replicate the city economies they have been applied to. But such approaches have had two general problems. The first is that the sectors selected haven’t been based on current assets within a city. And the second is that they have overly focused on buildings, marketing and specific sector ‘niches’, rather than attempting to increase the stock of knowledge across a number of areas.
In contrast, efforts by the private sector and civic institutions in this area have tended to focus more on building the stock of knowledge in cities. TechCity (the inspiration for TechNorth), based around Old Street in London, sprung up as a cluster based on knowledge long before it was rebranded by government. Current private sector led networks such as Birmingham Futures, which encourages networking between professional services firms, are more encouraging. So too is the Engine Shed in Bristol, which provides office space and networking events to encourage co-location of existing businesses across a number of sectors in the city.61
Restricting growth in London (and Birmingham)
Under the so-called ‘Brown Ban’ of the 1960s the national government actively restricted new office building in the capital.62 The thinking behind this approach was that if London was constrained, then businesses would choose to locate elsewhere in the UK. But if other cities were unable to offer both skilled workers and access to knowledge, then restricting the reinvention of London is unlikely to have made these cities any more attractive to investment from more knowledge-focused businesses. The result is that this approach is likely to have not only restricted the growth of the capital but of the national economy overall.
Such a restriction does not seem to have had long-lasting impacts on the performance of London. However, the ban was extended to Birmingham, and given the city’s struggles in recent decades (discussed in Box 7) the policy may have had a longer-lasting negative impact there.
Case study 5: A century of change in Blackpool
Blackpool’s growth as a tourist town began back in the 18th century. Its first visitors were middle-class holidaymakers to the seaside, but it was the arrival of the railway in the mid-19th century that spurred Blackpool’s rapid expansion, with its population quadrupling between 1851 and 1911 to 125,000. Iconic attractions such as the Grand Theatre63 and the Pleasure Beach64 were built in the closing years of the 19th century, and by 1910, Blackpool had 4 million visitors a year, most staying for a few days or a week.65
Blackpool owed much of its success as a tourist destination to the Lancashire tradition of wakes week, in which the mill towns would close down for a week in the summer. Each town’s mills shut during a different week, ensuring a steady stream of visitors to Blackpool during the summer, supporting the growth of its tourist industry and the city.66
Blackpool retained its tourist base throughout the interwar period. By the 1930s, around 7 million people visited annually.67 And by 1951, there were over 7,500 more jobs in tourism and entertainment in the city compared to 1911.
But the boom did not last. Between 1951 and 1981, total jobs in Blackpool declined by two per cent, reflecting a decline in sectors including logistics and construction. Despite the advent of package holidays this decline was not led by tourism, which saw its number of jobs increase by three per cent. The nature of the tourist trade did change though: the decline of the textile industry saw the end of wakes weeks; the building of the M55 motorway in 1958 brought about more day trippers than week-long holidaymakers; and the growth of package holidays and later on budget airlines in the 1990s drew tourists away from the seaside and towards the continent.68
One of Blackpool’s responses to this decline has been to increase investment in tourism and entertainment, investing in infrastructure and tourist attractions, including a failed bid for Britain’s first supercasino.69 Despite this investment, and an increase in visitor numbers to 13 million in 2014,70 there were over 2,500 fewer jobs in tourism and entertainment in 2013 than in 1991.
The city’s population has increased, in part due to a growing reputation as being a cheap place to live. An abundance of guesthouses, which are now much less popular due to changes in tourism, leave their own legacy. During the Second World War hundreds of hotels and guesthouses were commandeered by the government to house civil servants that were evacuated from the bombs falling on London.71 Now they have become attractive to housing benefit claimants, with implications for welfare dependency.72 In 2012-13, Blackpool had the highest welfare bill per capita of any UK city.73

Case study 6: A century of change in Brighton
Brighton’s tourism industry first developed during the 18th century, when claims that the seawater had healing benefits drew in wealthy visitors. By 1911, tourism and entertainment made up nearly 10 per cent of all jobs, and the industry remained largely unaffected during the First World War.74
Tourism and entertainment was not Brighton’s primary employer, however, and right from the early 20th century the city supported a number of light industries as well as knowledge-intensive services. Growth in these sectors helped drive an overall increase of around 13,000 jobs in the city between 1911 and 1951.
The city underwent a significant reversal of fortunes in the post war period. Between 1951 and 1981, Brighton saw a net loss of 14,000 jobs, 14 per cent of its total, with many of these losses in manufacturing and tourism and entertainment. However, the city did see some growth in KIBS jobs in this time, which increased by over 3,000, and by 1981 made up 11 per cent of all jobs.
The more recent about turn in Brighton’s economic performance has been even more spectacular. Since 1991, Brighton’s total number of jobs has nearly doubled from 78,500 to nearly 150,000. This has been driven by the rapid expansion of private sector KIBS activities, which saw a net increase of around 10,000 jobs (70 per cent growth). Large employers in this area are American Express, which has had its European headquarters in the city since 1977 and employed 3,500 people in 2010, and Legal & General and Lloyds TSB.75
Brighton’s city centre has played a significant role in this growth. Between 1998 and 2011, the city centre accounted for all of the city’s overall growth in private sector jobs, and one quarter of this total growth was in KIBS jobs.
Tourism-based jobs have also continued to grow in the city, expanding by nearly 200 per cent between 1981 and 2013. But unlike in Blackpool, Brighton has complemented the further expansion of the tourist industry with the expansion of KIBS jobs too.76
Brighton responded to its decline by focusing not on one pathway, but by seeking to support a broad range of industries and services. Its recent growth across a number of sectors means that today it has nearly 70 per cent more jobs than it had in 1911, and is well positioned to adapt to future changes in the economy.