03The nature of the new graduate workforce
The composition of the new graduate workforce
Figure 22 brings together all graduates who decided to work in Liverpool on graduation to provide an overview of the nature of the graduate workforce in the city. A quarter of all workers were home-grown, growing up, studying and subsequently working in Liverpool. One third of workers were those people who came to study in Liverpool and stayed for work. Finally, 27 per cent of new graduate workers had been attracted in from elsewhere.
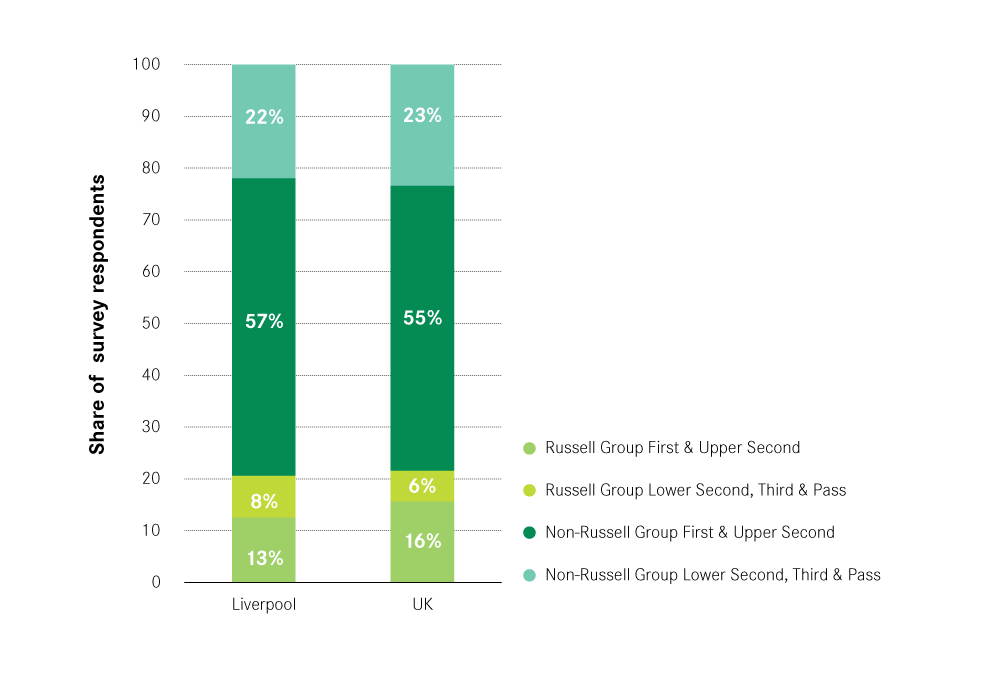
In terms of the class of degree achieved, a slightly smaller share of these workers had a first or upper second class degree from a Russell Group university than for the UK as a whole, as shown in Figure 23. Meanwhile the city had a slightly higher share of Russell Group graduates with a lower second class degree or lower.
Figure 22: The components of the new graduate workforce, 2013/14 – 2014/15

Figure 23: Share of working new graduates by class of degree, 2013/14 – 2014-15
Graduate wages in Liverpool are fairly low
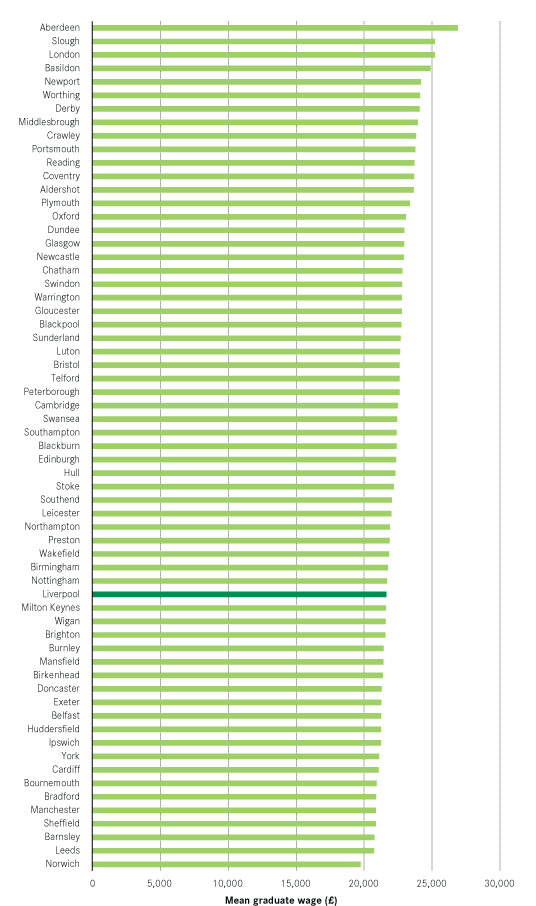
In comparison to other UK cities, graduates working in Liverpool on average earn £21,700, which is below the mean UK graduate wage of £23,100. Cities offering a similar wage were Nottingham, Milton Keynes and Wigan, as shown in Figure 24.5
Figure 24: Mean graduate wages of each UK city, 2013/14 – 2014/15
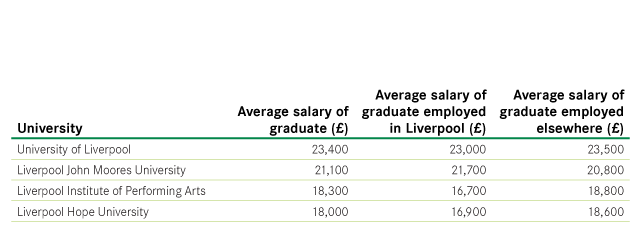
In terms of the city’s institutions, the average salary of a University of Liverpool graduate is higher than the other institutions in the city, and the average salary of a Liverpool Hope graduate is the lowest. With the exception of LJMU University, graduates who left Liverpool tended to earn more than those that stayed, as Figure 25 shows.
However, analysis of UK graduates finds that graduate wages was not the main reason for graduates choosing their employment location.6 Other factors such as the type of jobs available in that city and the opportunities for career progression are more important.
Figure 25: Mean graduate wages by institution and location of employment, 2013/14 – 2014/15
The majority of working graduates in Liverpool work in the publicly-funded services sector, and the proportion working in KIBS is considerably lower than the UK average
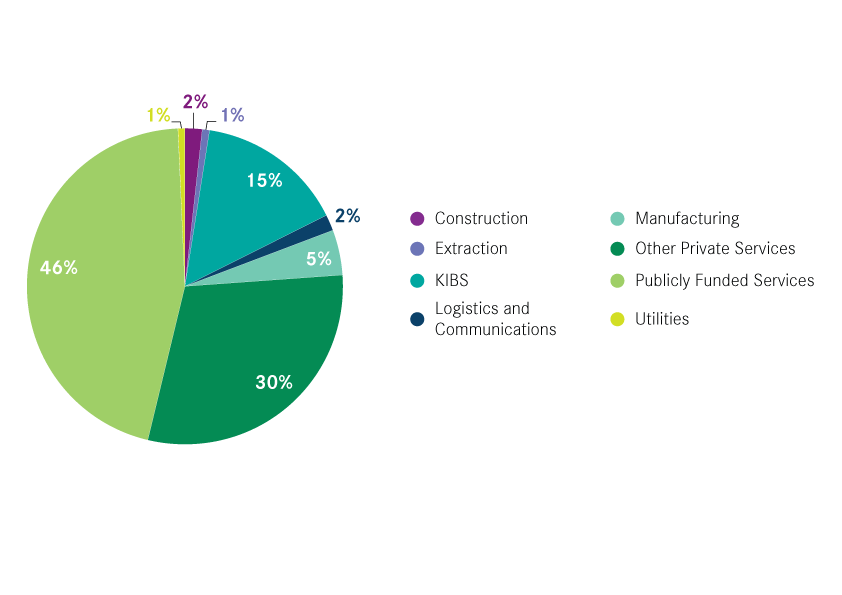
The type of jobs available to graduates in each location will be a major determinant of where they choose to work. Figure 26 shows that a much higher proportion of graduates in Liverpool work in publicly-funded services (57 per cent), than UK graduates on the whole (46 per cent). At 10 per cent, the share working in private knowledge intensive business services (KIBS) was lower than the UK average (15 per cent).
Looking at a finer industrial breakdown shows that 35 per cent of all graduate jobs were in health and 21 per cent in education. In the KIBS sector, 4 per cent of the city’s graduate jobs were in legal and accounting activities and 3 per cent were in financial services. Other prominent employers in the city were retail trade (5 per cent of graduate jobs) and food and beverage service activities (3 per cent). These jobs tended to be concentrated in the centre of the city. The L1, L2 and L3 postcodes combined were home to 28 per cent of all new graduate jobs, and 56 per cent of all new graduate jobs in the private sector.
Those who left Liverpool after graduating worked in different sectors to those who stayed to work in the city. Of the leavers, 18 per cent went on to work in a KIBS jobs, while 45 per cent went into a publicly-funded job. The analysis in The Great British Brain Drain showed that those cities with a greater number of jobs in KIBS industries tended to experience a greater graduate gain, while those more reliant on publicly-funded sectors to provide opportunities to new graduates were less attractive to graduates. This suggests that one of the reasons graduates left Liverpool was because of a lack of job opportunities.
Figure 26: Share of graduates in Liverpool working in each sector, 2013/14 – 2014/15
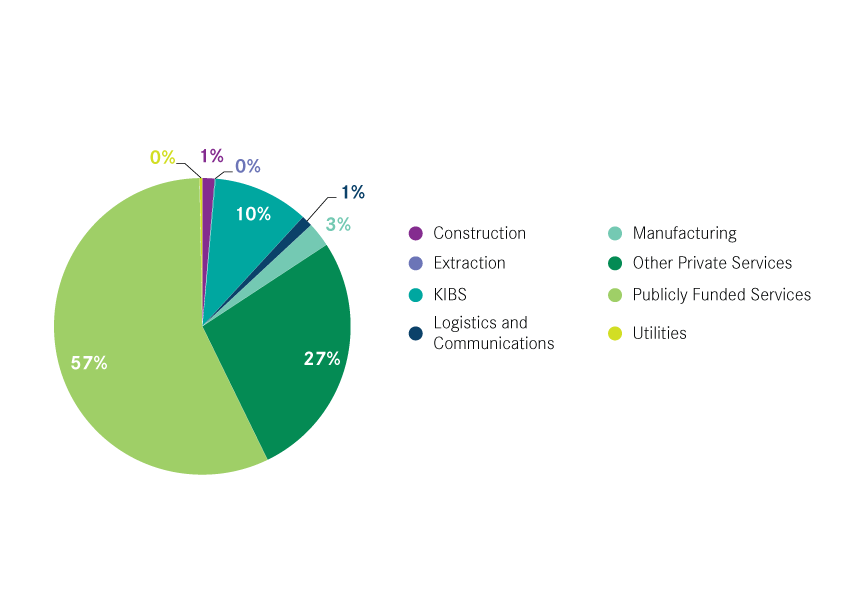
Figure 27: Share of UK graduates working in each sector, 2013/14 – 2014/15