
01The nature of migration between Liverpool and the rest of England and Wales
This section combines data on migration within the UK from the ONS and the 2011 Census to look at migration to and from Liverpool by age and qualification. This data does not include international migration.
Liverpool experiences a considerable churn of people
Between 2009 and 2015 143,380 people moved into Liverpool from England and Wales and 154,470 moved out. As a result there was a net outflow of 11,090 people from the city, the 8th highest net outflow from any UK city in that period. In comparison, Bournemouth experienced the largest net inflow of 15,100 people and London the largest net outflow of 340,310 people.
Much of this migration was between Liverpool and the rest of the North West. Half of those moving into the city came from elsewhere in the region, and 55 per cent of those leaving Liverpool stayed within the region. As a result there was a considerable net outflow to elsewhere in the North West between 2009 and 2015, as shown in Figure 1. Beyond the North West, Liverpool also saw a net outflow to the London region. In contrast, there was a net inflow to the city from every other region.
Looking specifically at cities, the largest net outflows from Liverpool were to London and Manchester (see Figure 2), while the largest net inflows were from Hull and Birmingham.
Figure 1: Net regional migration into Liverpool, 2009-2015
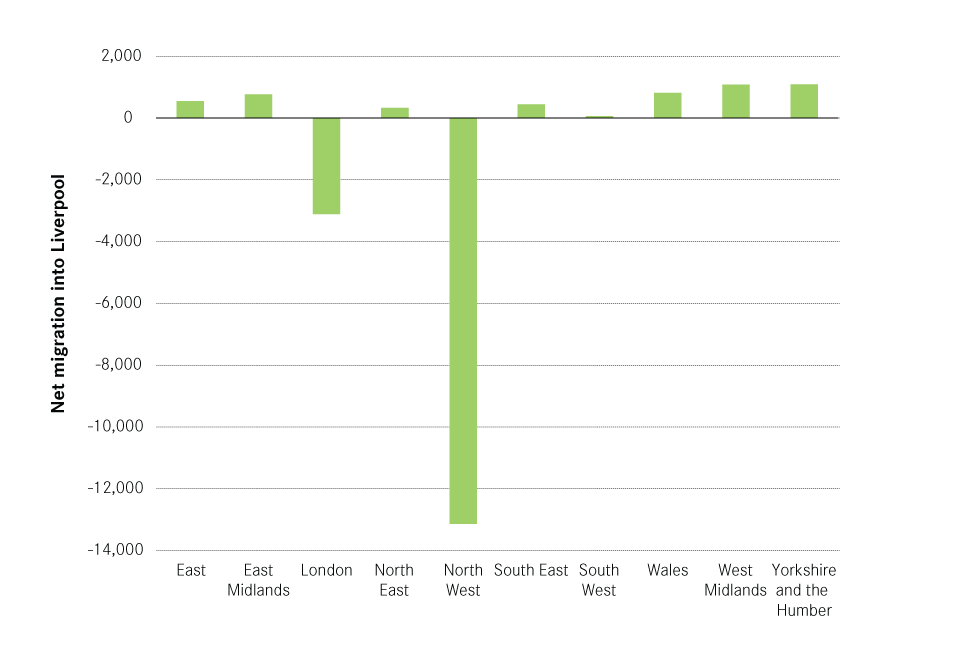
Figure 2: Net flow of people from UK cities into Liverpool, 2009-2015

Liverpool gains young people and loses older people
The pattern of migration varied greatly by age. Figure 3 shows how the movement of young people dominated Liverpool’s migration patterns. Despite only accounting for 8 per cent of the population of the city, 16 to 21 year olds accounted for 37 per cent of inward migration. Similarly, 22 to 25 year olds accounted for 7 per cent of the population but 26 per cent of outwards migration.
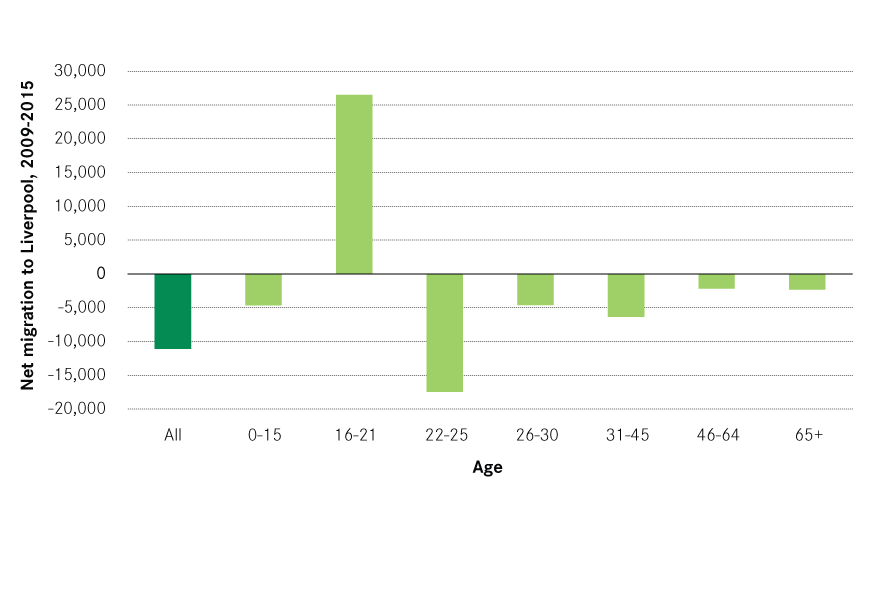
Overall, most age groups experienced a net outflow from Liverpool, the largest of which was a net outflow of 17,460 22 to 25 year olds (see Figure 4). In contrast, there was a net inflow of 26,500 16 to 21 year olds into the city.
Figure 3: Contribution of each age group to migration and to the city’s population, 2009-2015

Figure 4: Net inflow of people to Liverpool by age, 2009-2015
Liverpool loses degree holders to the rest of the country
While the ONS migration data does not provide information on the qualifications of migrants, the 2011 Census does for those who moved between 2010 and 2011. When the data is split into three age groups: 16 to 21, 22 to 30 and 31 to 45 year olds, three distinct trends emerge.
Liverpool saw a net inflow of 16 to 21 year olds from every region of England and Wales, with the North West (excluding Liverpool) providing the largest net inflow to the city (see Figure 5). These net inflows were dominated by people who held A-level qualifications or equivalent, highlighting the pull of the city’s universities which will be discussed in greater detail in the next section.
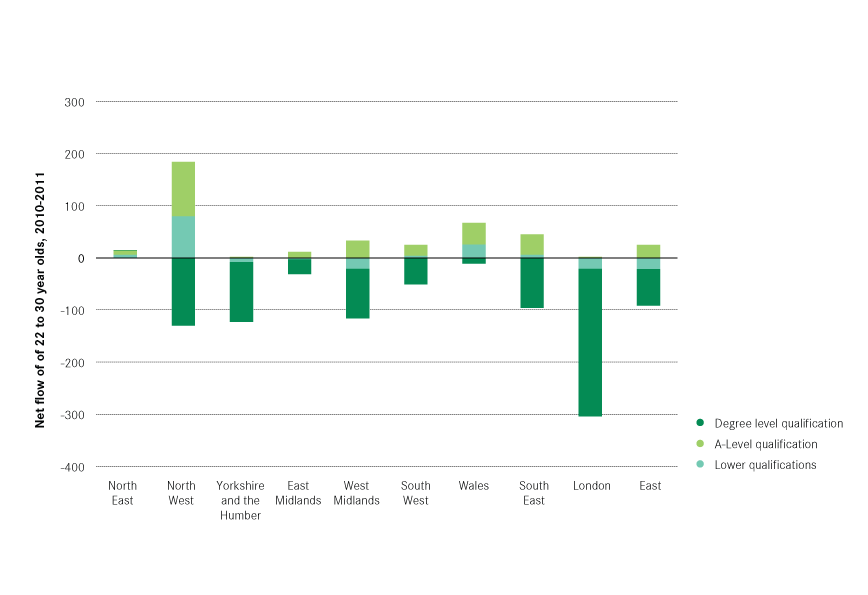
The net outflow of 22 to 30 year olds was dominated by degree holders. With the exception of the North East and Wales, Liverpool saw a net outflow of degree holders to every region of England and Wales. The largest was to the London region, as shown in Figure 6.
The city continued to lose degree holders aged 31 to 45. However the destinations of these movers were different from those in the 22 to 30 age group, as Figure 7 shows. The outflow of older graduates was mainly to the rest of the North West. Looking again at the wider migration data for 2009 to 2015, from the ONS, allows us to see movements between local authorities and shows that the majority of people did not travel very far. Sefton was the authority to which Liverpool lost the most people, followed by Wirral and St Helens. This means that these movers remained very much within commutable distance to Liverpool even if they no longer lived in the city.
There was also a very small net inflow of older graduates from London into the city. Looking again at the wider migration data suggests that authorities around Liverpool also saw a flow of older graduates in from the capital. It must be stressed, however, that while the flow was positive it was small.
Figure 5: Net flows of 16 to 21 year olds by region and qualification, 2010-2011
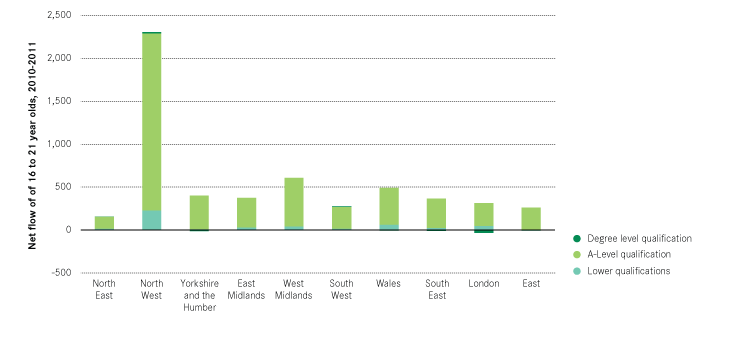
Figure 6: Net flows of 22 to 30 year olds by region and qualification, 2010-2011
This trend of older degree holders moving out of a city but staying within commutable distance is common to many UK cities. Previous work by Centre for Cities has shown that those aged between 35 and 54 tend to place more value on the size and type of their houses, and access to local schools, leading many to prefer living outside cites.2
Figure 7: Net flows of 31 to 45 year olds by region and qualification, 2010-2011

Summary
- Liverpool experienced an overall net outflow of people from the city to elsewhere in England and Wales between 2009 and 2015.
- However, there was a net inflow of 16 to 21 year olds with A-Levels to Liverpool. Many of these are likely to have been students going to university, which is explored in the next section.
- The city experienced a net outflow of 22 to 30 year old graduates, with London as the most popular destination. There was also a second outflow of older graduates from Liverpool, but the geography of this movement was different and most of these graduates remained inside the North West region.