
02A more detailed look at the movement of students and graduates
The data above suggests that universities play a large role in the movements of people to and from Liverpool. This section explores the migration patterns of students and graduates into and out of the city using two data sets from the Higher Education Statistics Authority (HESA). The first looks at admissions (for all students at university in 2014/15), and the second is based on a survey of graduates six months after graduation (for leavers in 2013/14 and 2014/15). Unlike the ONS data used above, it covers the whole of the UK and includes students who came from abroad.
Box 1: Higher education institutions in Liverpool
This analysis covers Liverpool’s four universities: University of Liverpool (UoL), Liverpool John Moores University (LJMU), Liverpool Hope University (Hope) and the Liverpool Institute for Performing Arts (LIPA). In the academic year 2014/15 there were 49,600 students enrolled at these universities, 46 per cent at UoL, 42 per cent at LJMU, 11 per cent at Liverpool Hope, and 1 per cent at LIPA.
Movements of students
Most students at university in Liverpool were from the North West
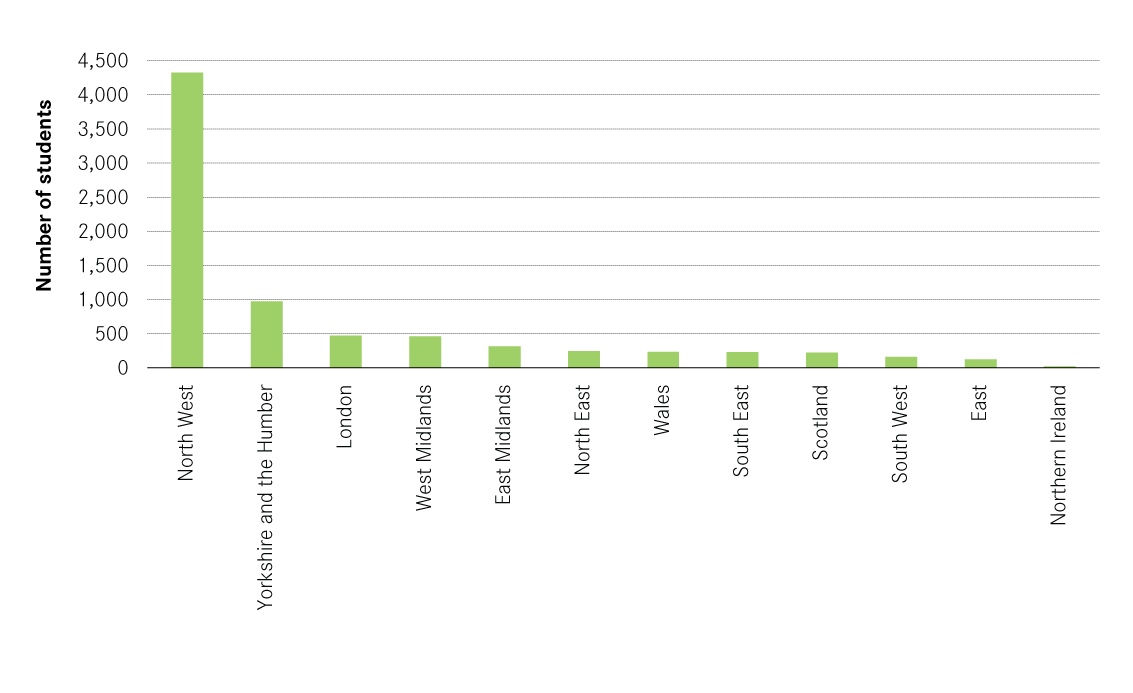
As a group, the pull of Liverpool’s universities was mainly regional; nearly half of all students at university in the city in 2014/15 were from the North West, with 16 per cent from Liverpool and 31 per cent from elsewhere in the region. Another 6 per cent of students came from the West Midlands. There were also a large number of international students: 17 per cent of students were from overseas, more than from the city itself.
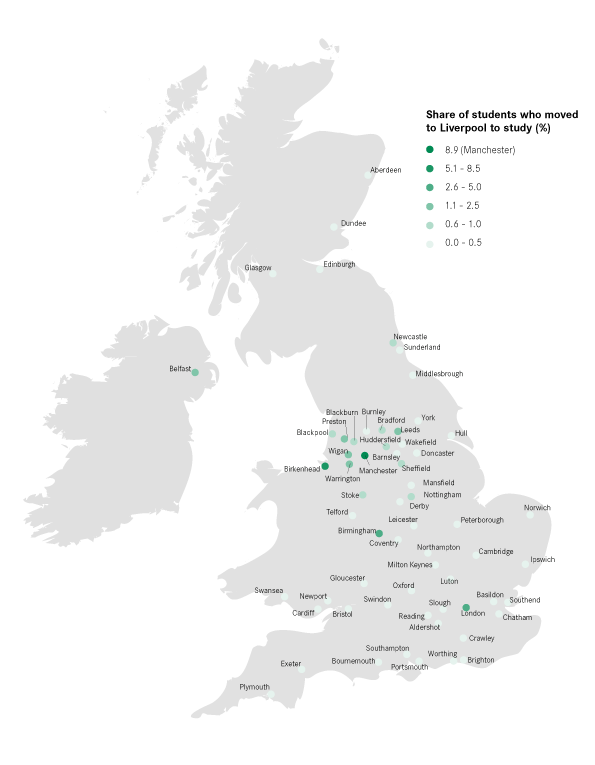
Looking specifically at cities, Figure 9 shows the share of students moving to Liverpool for university who came from each UK city. Manchester and Birkenhead were the most common urban origins, each contributing 6 per cent of students moving to Liverpool to study. Another 3 per cent of students moving to Liverpool for university were originally from London.
Figure 8: Origins of Liverpool university students, 2014/15
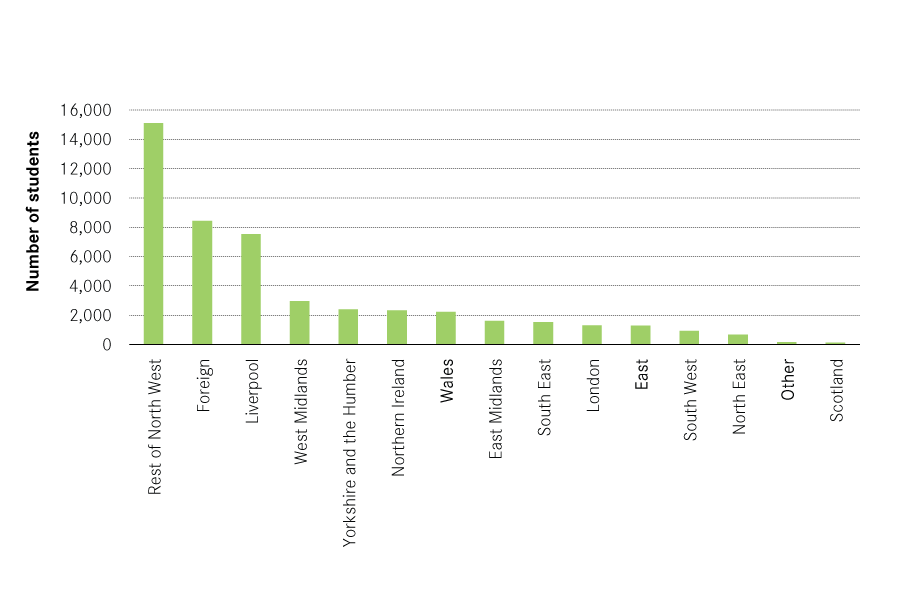
Figure 9: Origin cities of those students who moved to Liverpool for university, 2014/15
However, these patterns varied significantly by institution. At LJMU, 62 per cent of students were from the North West, with 21 per cent from Liverpool itself. Figure 12 shows how the proportion was similarly high for Liverpool Hope students, with 56 per cent coming from the region and 23 per cent from Liverpool. The pull of these institutions was therefore predominantly local. Other popular origin regions were Northern Ireland and the West Midlands.
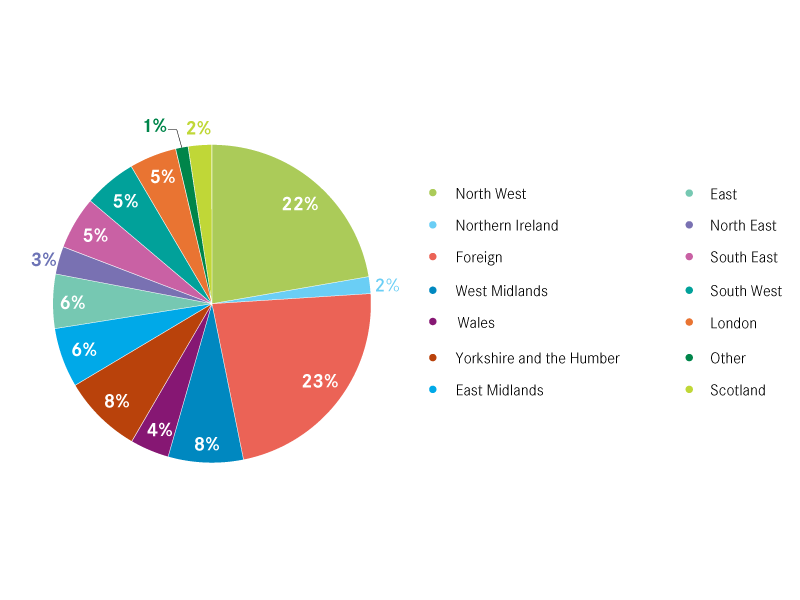
In comparison, University of Liverpool and LIPA had a wider pull. At the University of Liverpool, 31 per cent of students in 2014/15 were international, and 30 per cent were from the North West. The next most popular origin was the West Midlands. And at LIPA, 23 per cent of students were from abroad and another 22 per cent of students were from the North West region.
Figure 10: Origin of students at University of Liverpool, 2014/15

Figure 11: Origin of students at Liverpool John Moores University, 2014/15
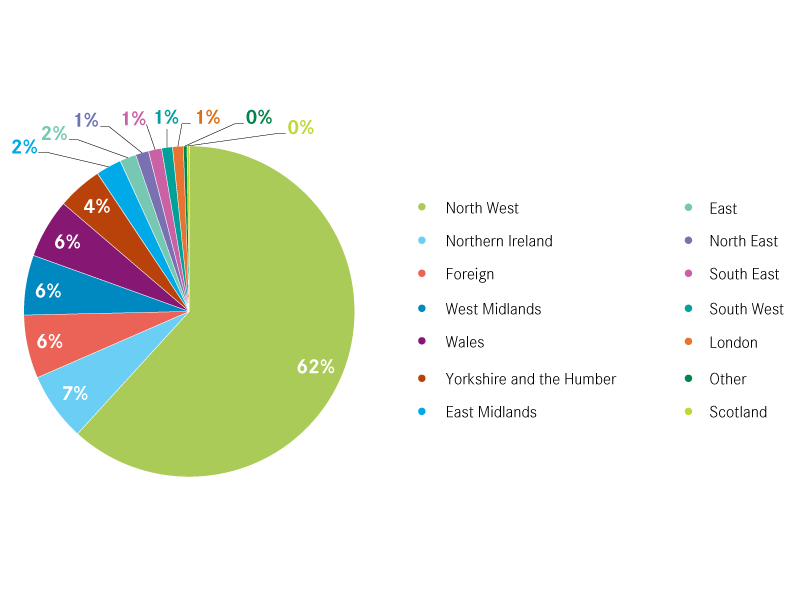
Figure 12: Origin of students at Liverpool Hope University, 2014/15

Figure 13: Origin of students at the Liverpool Institute of Performing Arts, 2014/15
Half of all students from Liverpool leave the city for university, but tend to stay in the region
Of the 15,320 young people from Liverpool who were attending a UK university in 2014/15, 49 per cent were studying in Liverpool. Of those who moved away, the most popular choice was to stay within the North West region (see Figure 15). As Figure 14 shows, Manchester was by far the most popular choice, with 14 per cent studying there. This was followed by Preston (6 per cent).
Figure 14: Destination cities of Liverpool students moving away for university, 2014/15

Figure 15: Destination regions of those moving away from Liverpool for university, 2014/15
Overall Liverpool attracted many more students for university than it lost
Reflecting the movements of young people seen in the previous section, many more students moved into Liverpool for university than left to study elsewhere. In 2014/15 the net inflow of UK students to Liverpool was 24,900, one of the highest net inflows across all UK cities: 32,700 students in Liverpool were from outside the city whilst 7,800 students at other UK universities were originally from Liverpool. Other cities which benefited from a similar net inflow were Leeds, Nottingham and Edinburgh who each saw net inward migration of 33,000 students.
Movements of new graduates post university
Graduate retention in Liverpool is relatively high
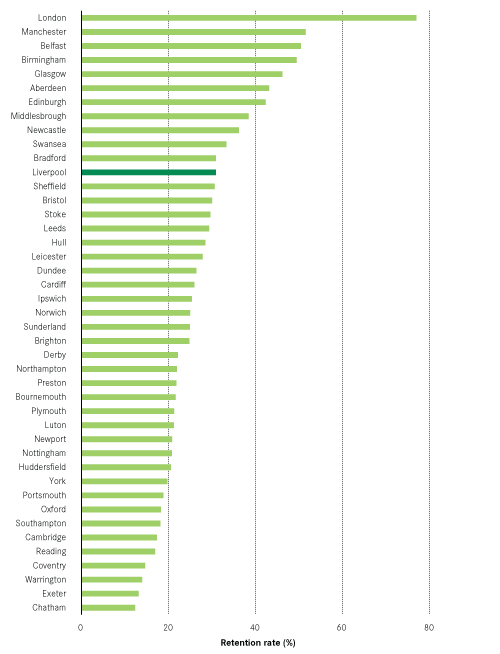
At 31 per cent, Liverpool had the 12th highest graduate retention rate of all university cities in 2013/14- 2014/15 (see Figure 16). However, as Figure 17 shows, this rate of retention varied greatly depending on which university the student attended. The proportion of graduates staying to work in Liverpool after graduation was highest for LJMU and Liverpool Hope. At 21 per cent, the University of Liverpool had a much lower retention rate, but this was not dissimilar to the retention rates of other Russell Group institutions.
Figure 16: Retention rates of each UK city, 2013/14 – 2014/15
Further nuance can be seen by splitting those who remained in Liverpool after graduation into two groups: those who grew up, studied and worked in Liverpool, and those who came in to study and stayed for work.
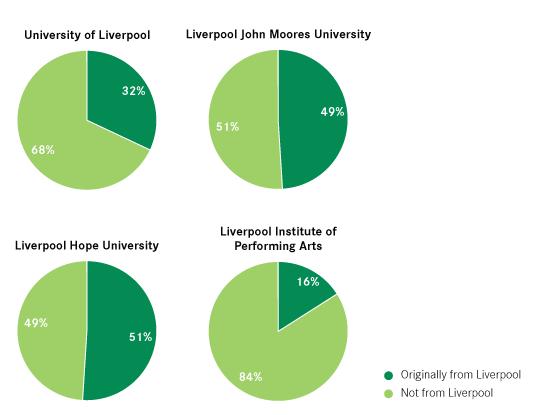
As Figure 18 shows, half of all retained students from both Liverpool Hope and LJMU were originally from the city, 51 per cent and 49 per cent respectively. In comparison, only 32 per cent of those retained by the University of Liverpool were originally from the city, while for LIPA this figure was 16 per cent.
This means that both LJMU and Hope University attracted the highest shares of Liverpool students, and relied on these home-grown students to achieve their high retention rates. This suggests that higher retention rates are driven by the regional pull of institutions. By implication, this means that the greater national and international outlook of the University of Liverpool and LIPA produces a lower retention rate.
Figure 17: Retention rate of each university in Liverpool, 2013/14 – 2014/15
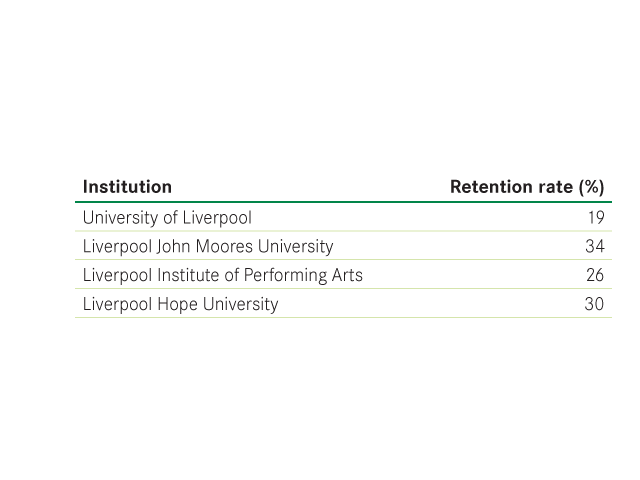
Figure 18: Proportion of all retained students from Liverpool and from elsewhere, 2013/14 – 2014/15
The most popular city destination of Liverpool’s graduates was Manchester
Of those graduates who did not work in Liverpool six months after graduation, Manchester was the most popular destination, with 13 per cent of Liverpool graduates working there. The next most common city to move to was London, where 9 per cent of Liverpool’s graduates were employed. As Figure 19 shows, the other popular cities were Birkenhead, Warrington and Birmingham.
Figure 19: Destinations of Liverpool graduates who move to other cities for work, 2013/14 – 2014/15

Liverpool was successful at attracting new graduates home, but less successful at attracting new graduates from elsewhere
The final component of graduate migration consists of those who are attracted into Liverpool after graduation to work. While graduate retention figures tend to be given a lot of attention, the ability of a city to attract in new graduates from elsewhere is also an important part of increasing the number of degree holders in a city.
Again this cohort can be split into two groups: those that grew up in Liverpool, moved away, and then returned for work, and those that moved in for work but had not lived in the city previously. Of those students who moved away from Liverpool to study, 50 per cent returned for work. This was the 6th highest of all UK cities.
Liverpool was relatively less attractive to new graduates who had not lived in Liverpool before. The number of new graduates attracted in for work that had no connection to Liverpool was equivalent to 15 per cent of all students studying in the city. This placed Liverpool 31st out of 44 university cities.4
Liverpool gained graduates overall
Putting this data on student and new graduate moves together shows that overall Liverpool experienced a ‘graduate gain’, attracting in more graduates who had grown up elsewhere (and had either moved to Liverpool to study and subsequently stayed, or moved in after graduation) than the number of people lost who grew up in Liverpool but worked elsewhere upon graduation. Figure 20 shows the size of this graduate gain, of 2,600 survey respondents. In absolute terms, this placed Liverpool as the 7th highest gainer of graduates, when compared with other UK cities; London gained 56,000 of the graduates who responded, Manchester gained 10,000 and Leeds gained 6,000.
This finding may not appear to square with the earlier finding about the outflow of young graduates from Liverpool. This is because there is one final cohort of students: the ‘bouncers’. These students move into Liverpool to study, and leave straight after graduation. Of all the students who moved to Liverpool to study, 79 per cent bounced. As Figure 21 shows, the number of bouncers was far larger than the graduate gain driving the outflow of young graduates shown earlier.
This cohort causes a lot of noise in the data. Removing them and looking at the share of (would be) graduates in Liverpool before university and the share of graduates in the city after graduation, shows Liverpool to experience a graduate gain.
Figure 20: Comparing students lost and graduates gained by Liverpool, 2013/14 – 2014/15
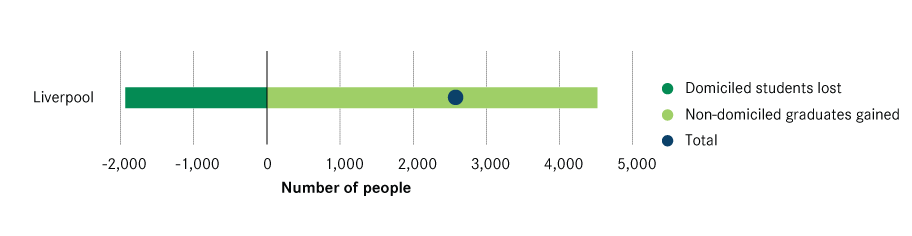
Figure 21: The bouncers and the graduate gain, 2013/14 – 2014/15
