
02What does the data show?
This section explores 10 years of economy tax data to show where taxes are generated across British cities and how this has changed over time. All data shown is in 2014/15 prices.
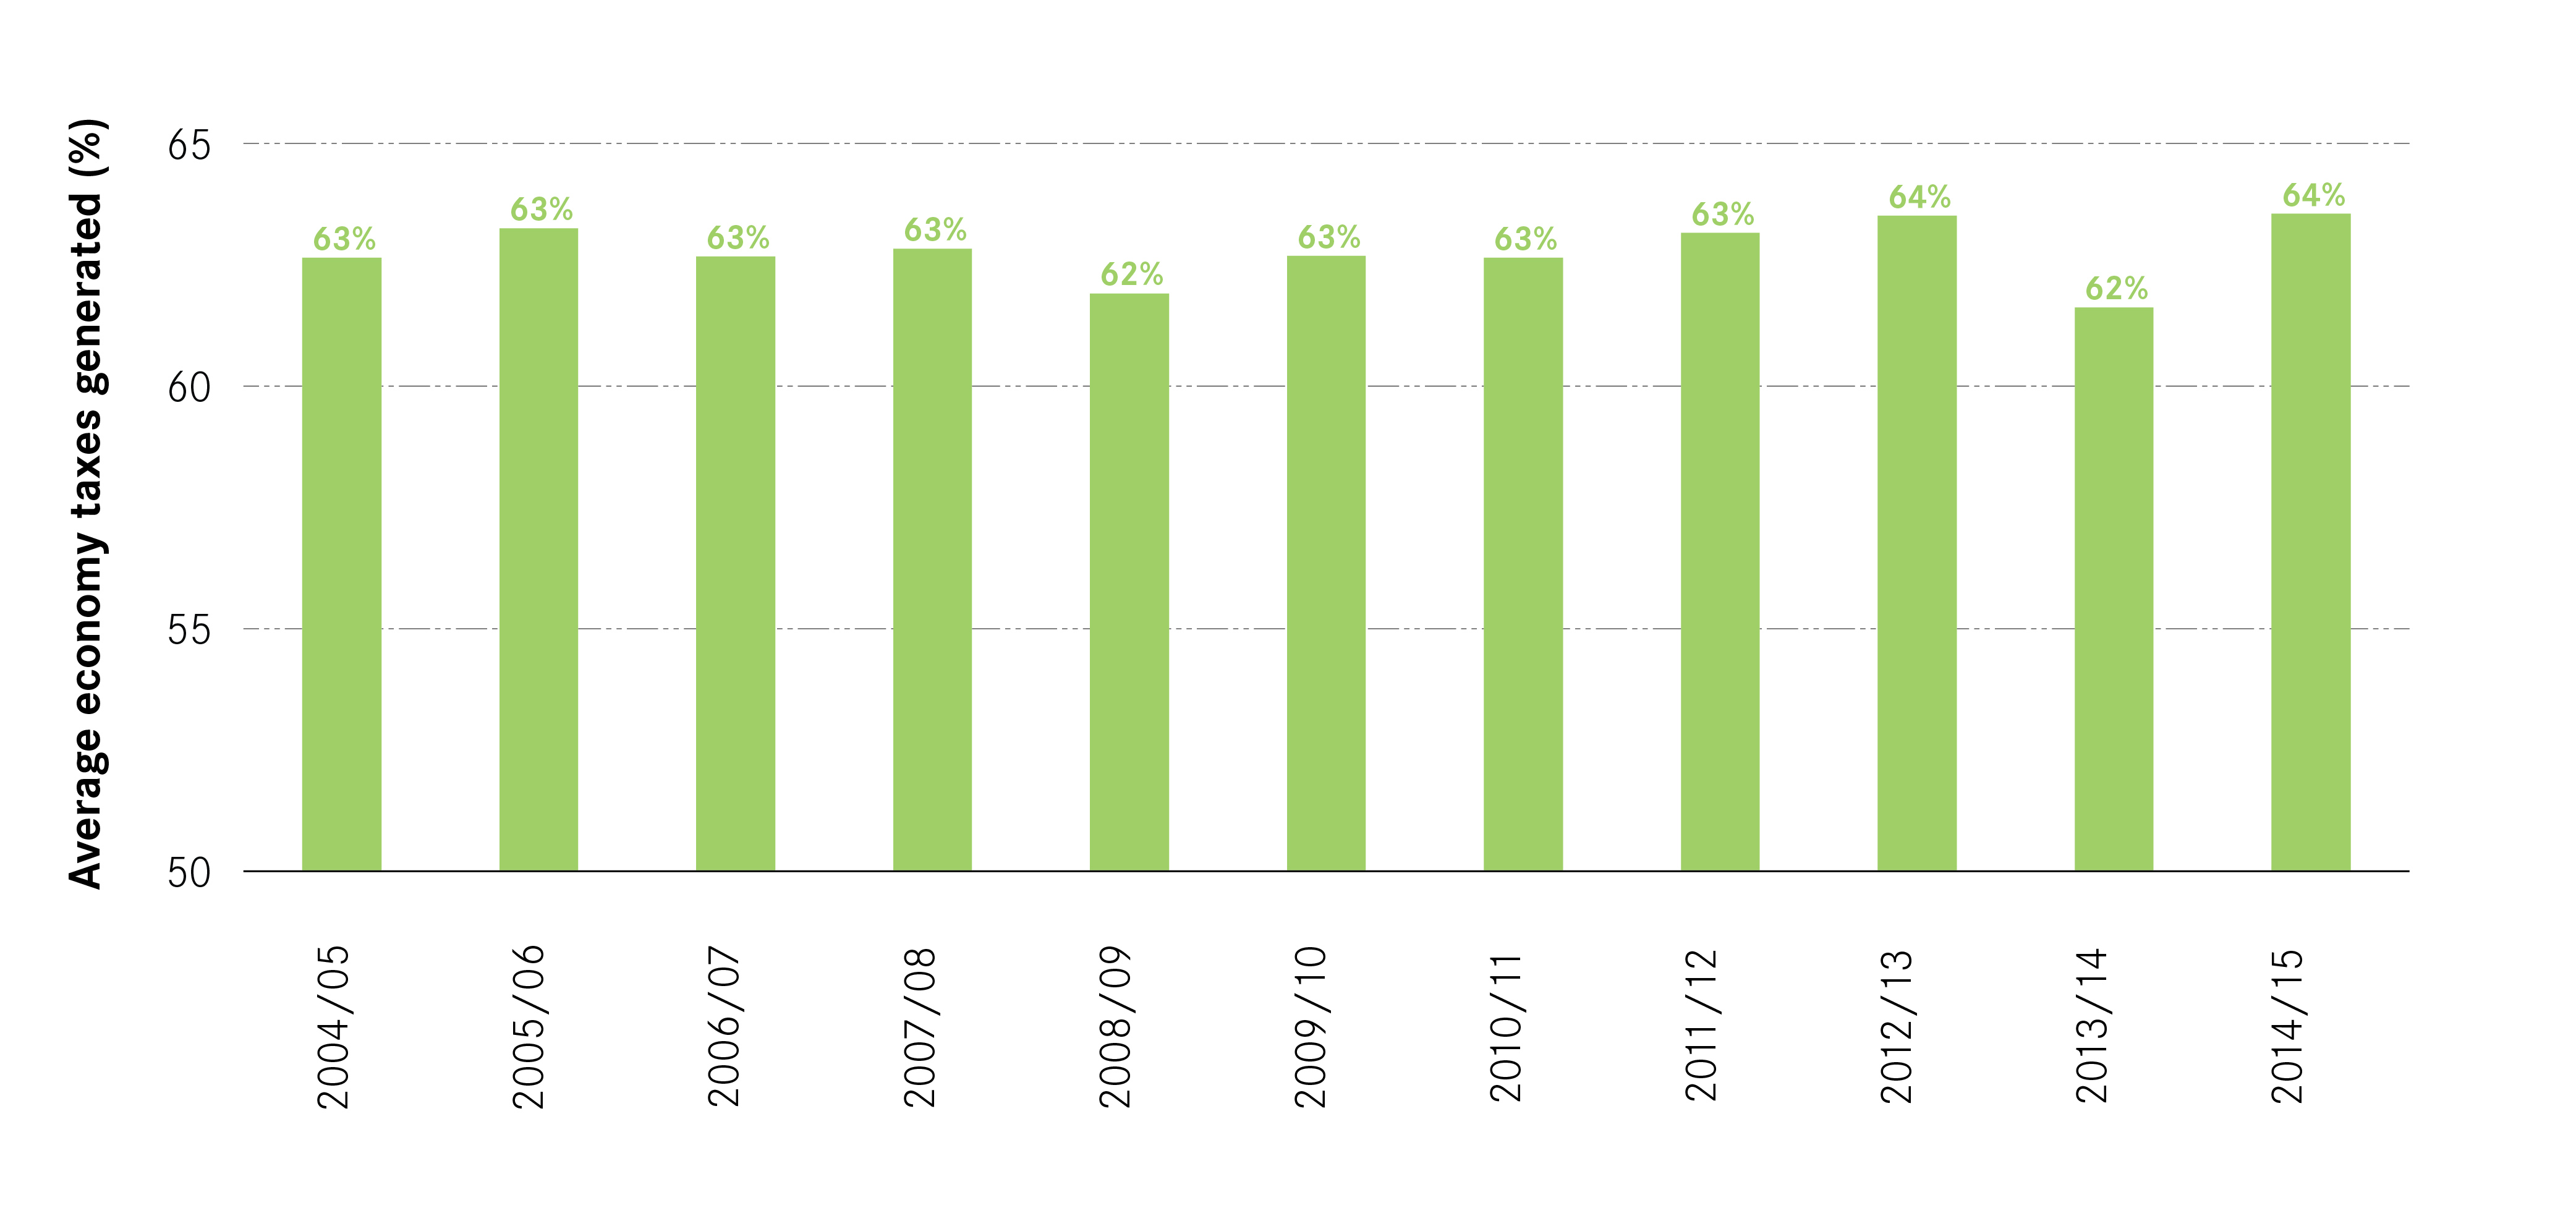
Cities have consistently generated the lion’s share of Britain’s tax revenues over the decade, see Figure 2 below. While cities account for only 8 per cent of the land mass and 59 per cent of jobs, they generated 64 per cent of all economy taxes in Britain in 2014/15. And they are also more productive, generating £2,682 more per year per job in economy taxes more than non-city areas (average over the decade).
Figure 2: National contribution of economy taxes generated in cities, 2004/05 to 2014/15
The exchequer is reliant on revenues generated in cities both for the amount of revenues generated in urban areas and the efficiency with which those revenues are created (i.e. more tax per job). But while the contribution and composition of urban taxes to the total economy tax take has remained relatively stable over the decade, this masks significant variation in patterns of taxes generated between different cities over time.
Five key findings emerge from the data:
- British cities generate less tax than they did 10 years ago
- Cities have become less productive over time
- Smaller cities have increased their taxes more but big cities remain crucial
- The reliance on London has increased over time
- The ‘great recession’ had a significant and long-term effect on levels and patterns of taxes generated across British cities.
1. Almost a third of cities have experienced a real-terms decrease in the level of taxes generated in their area
Although the amount of taxes generated in cities has risen by 12 per cent over the decade, from £283 billion in 2004/05 to £317 billion in 2014/15, 20 out of 62 British cities are actually generating less than they were 10 years ago.
Figure 3 below shows the change in total revenues collected in different cities in the past 10 years and the variation between different cities. Total revenues have increased the most in cities such as Aberdeen (32 per cent increase) and London (25 per cent increase), while in others the change is less significant in real terms. In York and Sunderland, the amount of economy taxes generated today is only 1 per cent greater than it was a decade ago (in real terms). The sharpest declines in tax revenues were in cities such as Northampton (12 per cent decrease) and Newport (9 per cent decrease), while in Wakefield and Cardiff revenues are less than 1 per cent lower (in real terms) that they were 10 years ago.
Figure 3: Difference in economy taxes generated in cities, 2004/05 and 2014/15
Figure 4 shows that the cities where taxes generated have fallen over the decade are located in the Midlands and the North. But there is not a simple North-South divide: not all cities in the South have seen their tax base grow while cities like Aberdeen, Derby and Liverpool have seen increased tax generation over the decade.
Figure 4: Difference in economy taxes generated in cities, 2004/05 and 2014/15
2. Cities are more ‘tax productive’ than elsewhere but have become less so
Cities are more ‘tax productive’ than elsewhere in terms of the amount of tax generated per job. Over the decade workers in cities have generated on average £2,682 more economy tax per job than non-city areas. The amount of tax generated per job has also risen in cities, from £18,305 per job in 2004/05 to £18,657 per job in 2014/15.
But this overall increase masks the fact that the majority of British cities (40 out of 62) are actually generating less tax per job than they were a decade ago and ignores the significant gains made in some cities relative to others – see Figure 5 below. Tax generated per job has fallen the most over the decade in Northampton, Basildon and Wigan, while in Plymouth and Milton Keynes the change is close to zero.
In Ipswich and Aberdeen the average amount of tax generated per jobs has increased by 19 and 16 per cent respectively between 2004/05 and 2014/15, but in the majority of cities where tax per job has increased (18 out of 22), the change has been less than 5 per cent.
Figure 5: Difference in economy taxes per job, 2004/05 and 2014/15
Figure 6: Economy taxes generated per job, rank 2004/05 and 2014/15
![]()
(view the data for each year on the data tool)
3. Smaller cities have increased their taxes most but big cities remain crucial
London aside, small and medium cities sized cities have increased the amount of tax they generate the most over the decade. Of the cities that increased the amount of taxes they generated the most between 2004/05 and 2014/15, all except London were small and medium sized and with the exception of Aberdeen and Derby were located in the Greater South East – see Figure 7.
This increase reflects the strong economic performance of these cities over the decade and highlights the importance for policymakers of focusing on supporting the economic growth of these cities.
Figure 7: Cities with highest difference in tax revenues, 2004/05 and 2014/15
However, it is also important to distinguish between the rates and levels of tax that different cities have generated over the decade, and how this translates into revenues for the public purse. Despite growing its tax revenues by only 1 percentage point over the decade, Manchester contributed £178 billion to the national tax pot in that time, only slightly less than the top growth cities (excluding London) combined.
Figure 8: Difference in economy taxes generated vs total economy taxes generated

4. The exchequer’s reliance on London has increased over time
Although British cities are contributing almost the same share of taxes to the national pot than a decade ago, these tax revenues are being generated by fewer cities. In 2004/05 the top 10 largest cities6 generated 66 per cent of all urban economy taxes, in 2014/15 this had risen to 68 per cent.
But the most significant shift has been the change in London’s contribution to the national finances. In 2004/05, London generated as much economy tax as the next 24 largest cities combined (40 per cent of all economy taxes generated in cities). In 2014/15 the capital created almost as much tax as the next 37 cities (45 per cent of the urban total). This shift is even more staggering when looking specifically at labour taxes.7 10 years ago London generated more income tax and NICs than the next 34 largest cities, today the capital generates more of these taxes than the next 60 largest cities.
5. The recession was a clear turning point for tax raising in British cities
Soon after the fall of Lehman Brothers in September 2008 in New York, the UK went into recession in the second quarter of 20088 and officially came out of recession in the fourth quarter of 2009. Prior to the recession, between 2004/05 and 2007/08, total tax revenues generated in cities grew by 13 per cent, from £283 billion to £319 billion (2014/15 prices). Nearly every city, except Blackpool and Blackburn, saw tax revenues generated in their area increase during this period.
The recession caused a two-year dip in taxes generated in cities. The impact of the recession, resulted in significantly lower levels of tax generated in the financial years 2008/09 and 2009/10. Between 2007/08 and 2008/09 revenues generated in British cities fell from £319 billion to £300 billion (6 per cent) and then by a further 8 per cent the next year to a low of £277 billion.
Figure 9: Economy taxes generated in cities, 2004/05 to 2014/15
Figure 10: Economy taxes generated over time in cities (excluding London), 2004/05 to 2014/15
The immediate impact of the recession varied across cities. All cities but one saw their economy taxes fall between pre-recession peak in 2007/08 and the trough in 2009/10. Figure 12 shows the change in revenues over the course of the two years in which the country was in recession. Tax revenues generated in Telford fell the furthest of any British city, decreasing by 23 per cent, followed by Norwich (-21 per cent), Bournemouth (-20 per cent), Peterborough (-20 per cent) and Southampton (-20 per cent), while in Exeter the amount generated at pre-recession peak was almost the same as in 2009/10.9
However, the biggest losses during this period were in London where revenues fell by £18 billion between 2007/08 and 2009/10, followed by Birmingham (£2.9 billion), Manchester (£2.3 billion), Edinburgh (£1.1 billion) and Leeds (£871 million).
Looking at tax productivity, there is a similar trend. Prior to the recession, between 2004/05 and 2007/08, tax productivity increased in all but three cities (Blackpool, Blackburn and Derby). And during the recession, average levels of economy tax generated by worker fell by a total of 16 per cent over the period, or £3,207 per job in cities: from £20,394 in 2007/08 to £19,104 in 2008/09 and to a low of £17,184 in 2009/10.
Figure 11: Difference in tax revenues generated, 2004/05 and 2007/08
Figure 12: Difference in tax revenues generated, 2007/08 and 2009/10
Figure 13: Difference in tax revenues generated in 2009/10 and 2014/15
Most cities have not fully recovered from the recession. Post-recession, most cities (56 out of 62) have seen their tax revenues increase. Only Exeter, Nottingham, Preston, Bradford, Swindon and Gloucester are generating less tax today than they were in 2009/10.
However, only 15 out 62 cities are today generating more tax than they were at their pre-recession peak levels. And in most cities, tax revenues are increasing year on year at a slower rate than before the recession (see Figure 14): in almost two-thirds of cities (41 out of 62) the average rate of growth in the post-recession period is lower than it was pre-recession.
Figure 14: Average annual economy tax growth rate in cities, before, during and after the recession

The pattern is similar, if more pronounced, when looking at tax generated per job. Productivity has increased since the lowest point of 2009/10 in all cities except Bradford, Wigan, Luton and Nottingham. But few cities have returned to their pre-peak levels: only 3 out of 62 cities (Derby, Aberdeen and Crawley) are more productive in terms of tax today than they were before the recession.
Summary and implications
The data on 10 years of city taxes highlights the changing patterns of taxes generated across the country, and reveals a far more polarised ‘fiscal map’ of urban Britain at the end of the decade than at the start.
Despite cities generating more tax than before (and a similar share of the national total), almost a third of cities are actually generating less tax than they were 10 years ago and the average level of tax generated per job has gone down in real terms in two-thirds of British cities. As a result fewer cities are now playing a more important role in contributing to the national tax pot than was the case 10 years ago, with a particular turning point coming around the ‘great recession’, which hit cities hard and has changed the long-term trajectory of their economies.
In the face of political and economic uncertainty and potential shocks to the economy, this growing reliance on fewer places to generate larger and larger tax revenues is more risky than a more diversified fiscal map. If the recession in particular caused a divergence in tax raising power, how well prepared is the economy from a geographic perspective for potential future shocks?
It also raises questions about the ability to generate tax from growth in the economy and specifically from the so-called ‘jobs miracle’ that has powered the recovery since the ‘great recession’. If the number of jobs has grown in almost all cities over the decade, why do we observe the patterns of city-level taxes that we do?
The next section goes on to explore this puzzle and the complex relationship between the level of taxes generated and the nature of the recovery at the city level.