Nearly a million new jobs created in British cities since 2010, but average salary drops by £1,300 per city resident
Cities Outlook 2016 looks at how to deliver the Government's ambition to create a high wage, low welfare economy.
Cities Outlook 2016 looks at how to deliver the Government's ambition to create a high wage, low welfare economy.
A new report by leading think tank Centre for Cities reveals that more than 980,000 new jobs were created in UK cities between 2010-14, but that urban wages fell by 5 per cent in the same period – a decrease in average annual salary of £1,300 per city dweller in real terms.
Cities Outlook 2016, the Centre’s annual health-check on the economies of the UK’s 63 largest cities, focuses this year on the Chancellor George Osborne’s vow to build a “higher wage, low-welfare” economy in Britain, as set out in the Summer Budget 2015.
It shows that despite the jobs boom between 2010-14 – with cities accounting for around three quarters of new jobs created in this period – nearly half (29) of UK cities are currently classified as having ‘low-wage, high-welfare’ economies, highlighting the scale of the challenge facing the Government in realising its economic vision.
However, the report also shows that 14 UK cities are already delivering ‘high-wage, low-welfare’ economies (1) – offering lessons for national and local policy-makers on how they can help low-wage places to fulfil their economic potential, while supporting high-wage places to continue to grow.
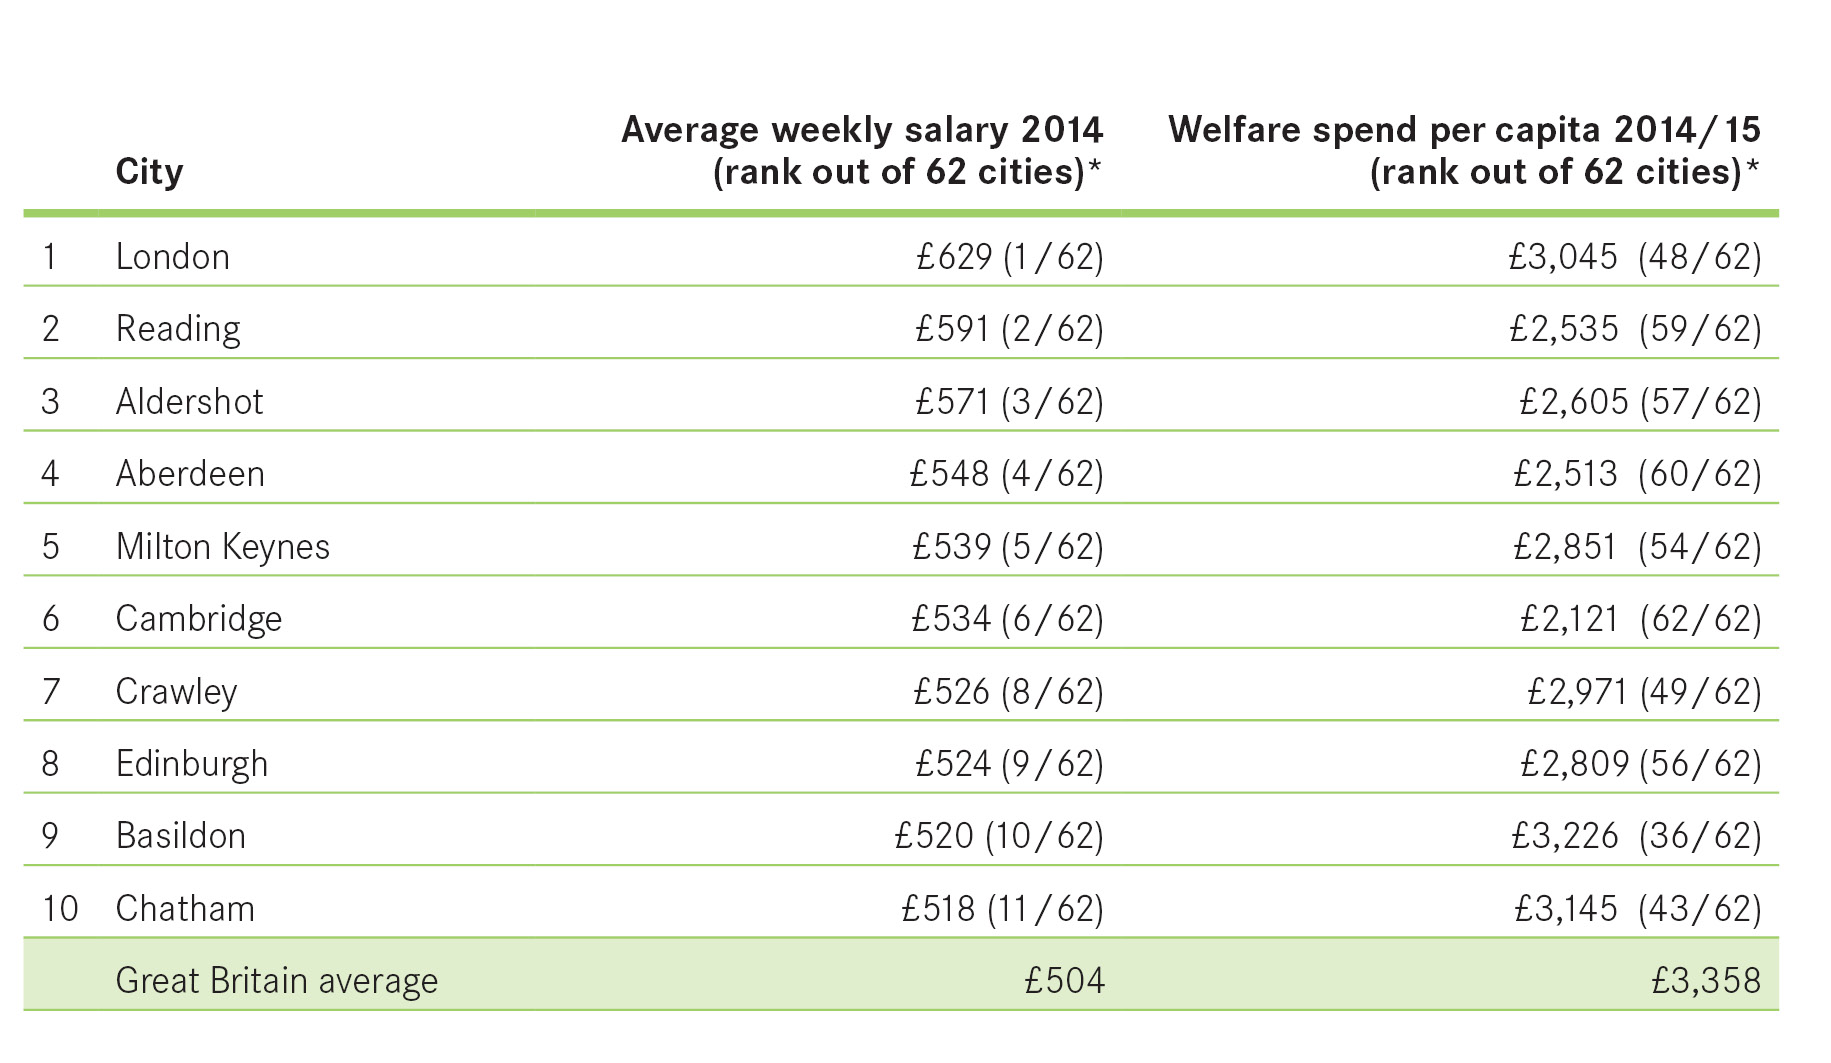
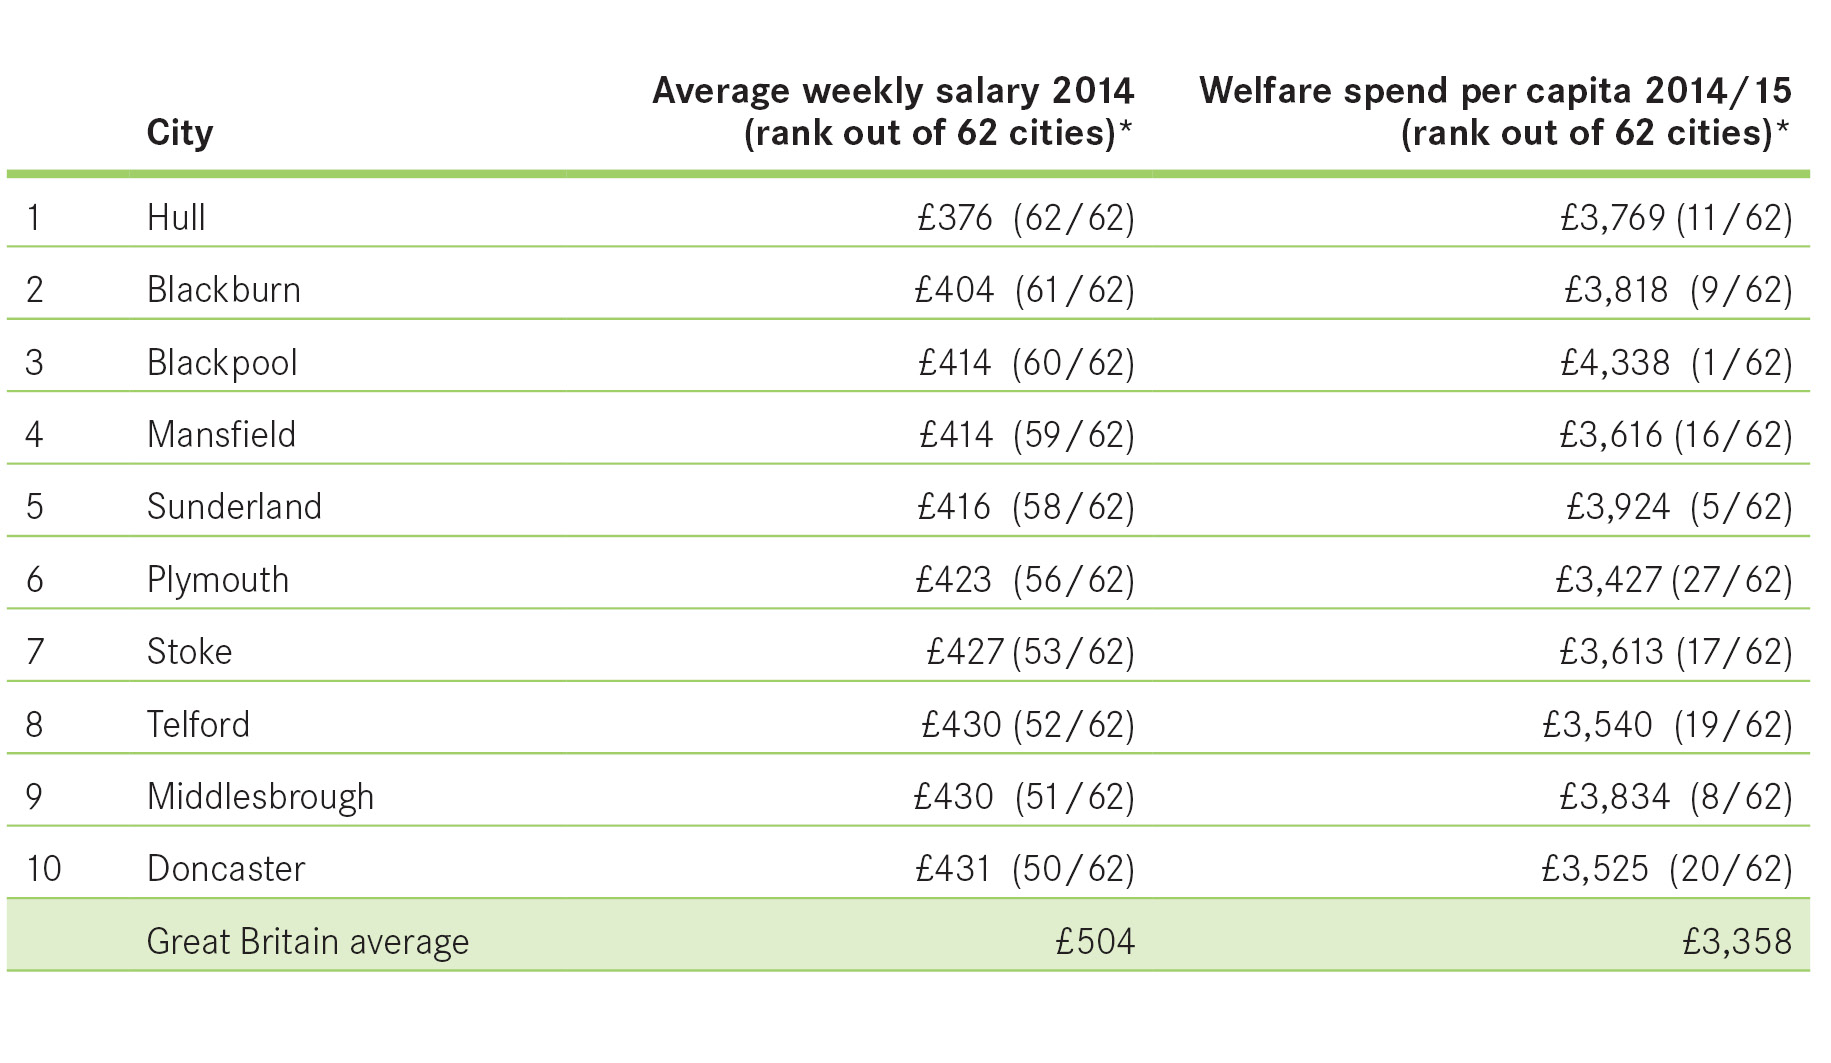
Note: Data for Belfast is unavailable
Cities Outlook 2016 features a number of important findings which should inform Government policy as it seeks to build a higher-wage, lower-welfare economy over the next four years:
Commenting on the findings of Cities Outlook 2016, Alexandra Jones, Chief Executive of Centre for Cities, said:
“Cities Outlook 2016 highlights the size of the challenge facing the Government in building a high-wage, low-welfare economy, and the importance of supporting and empowering UK cities in order to make that vision a reality.
“One of the most pressing issues is the need to tackle skills-gaps and improve schools attainment, especially in low-wage cities, to help those places attract businesses and jobs, and support more people to move into work, particularly in high-skill sectors. This should be a key part of the Government’s Northern Powerhouse initiative alongside investment in infrastructure, and a top priority for local leaders. For cities which have seen strong growth in wages and jobs, the focus should be on addressing housing shortages, to ensure that their success isn’t derailed by a lack of affordable homes.
“Cities also need more powers and incentives to boost jobs and wages. Giving places control over skills and welfare budgets, and allowing them to keep any savings made by reducing the welfare bill, would incentivise local leaders to invest in employment programmes that, if successful, would reduce people’s need for benefits payments. Further devolution would also enable local leaders to make spending decisions which better meet the needs of their communities and give them more incentives to drive economic growth.”
ENDS
For more information, or to set up an interview with Alexandra Jones, please contact Brian Semple, Press Manager for the Centre for Cities, on 0207 803 4316 / 07595 439 638 or b.semple@centreforcities.org
NOTES TO EDITORS
(1) – In the report, cities where average wages are higher than the national average, and welfare spending is lower, are categorised as ‘high wage, low-welfare’. Places where average wages are below the national average, but welfare spending is above, are classed as ‘low-wage, high-welfare’.
(2) & (3) – Top ten ‘low-wage, high-welfare’ cities are ranked in order of lowest average wage, excluding places with lower than average welfare spend. Top ten ‘high-wage’ cities are ranked in order of highest average wage, excluding places with higher than average welfare spend
Cities Outlook and the Centre for Cities
Cities Outlook is the authoritative annual economic index of the UK’s 63 largest cities and towns, prepared by the Centre for Cities – an independent, non-partisan research and policy institute. Committed to helping Britain’s cities improve their economic performance, the Centre produces practical research and policy advice for city leaders, business and Whitehall.
Report data sources:
Numbers of new jobs: ONS 2015, Business Register and Employment Survey
Average wages: ONS 2015, Annual Survey of Hours and Earnings
Welfare Spending: DWP 2015; HMRC 2015; DCLG 2015; Welsh Government 2015; Scottish Government 2015
General data note:
All wages and welfare figures are quoted in 2015 prices. To account for inflation, a GDP inflator (source HM Treasury) was applied to this data.