
10 years of tax in combined authorities
Employment growth over the past 10 years has not translated into higher tax revenues.
Employment growth over the past 10 years has not translated into higher tax revenues.
As Devolution Deals between the government and mayoral combined authorities in England press on, calls for the devolution of fiscal powers alongside policy powers are growing louder every day. Last week the MP for Rotherham Sarah Champion called for local areas to have more control over their money in her response to the creation of a Mayor for Sheffield City Region. But in order to make sure any future fiscal devolution is a success, there will be a need to understand more about where and how taxes are generated in, and within, combined authority areas.
Building on the analysis conducted for our latest report Ten years of tax: how cities contribute to the national exchequer, this is the first of two blogs which looks at the data on taxes generated in combined authorities between 2004/05 and 2014/15. It explores some of the similarities and differences in the growth and composition of the tax base of the different combined authority areas. Notwithstanding the significant growth in London’s tax base (which we explore in more detail in the main report) the data highlights some interesting variation between combined authorities outside the capital.
Three key points stand out:
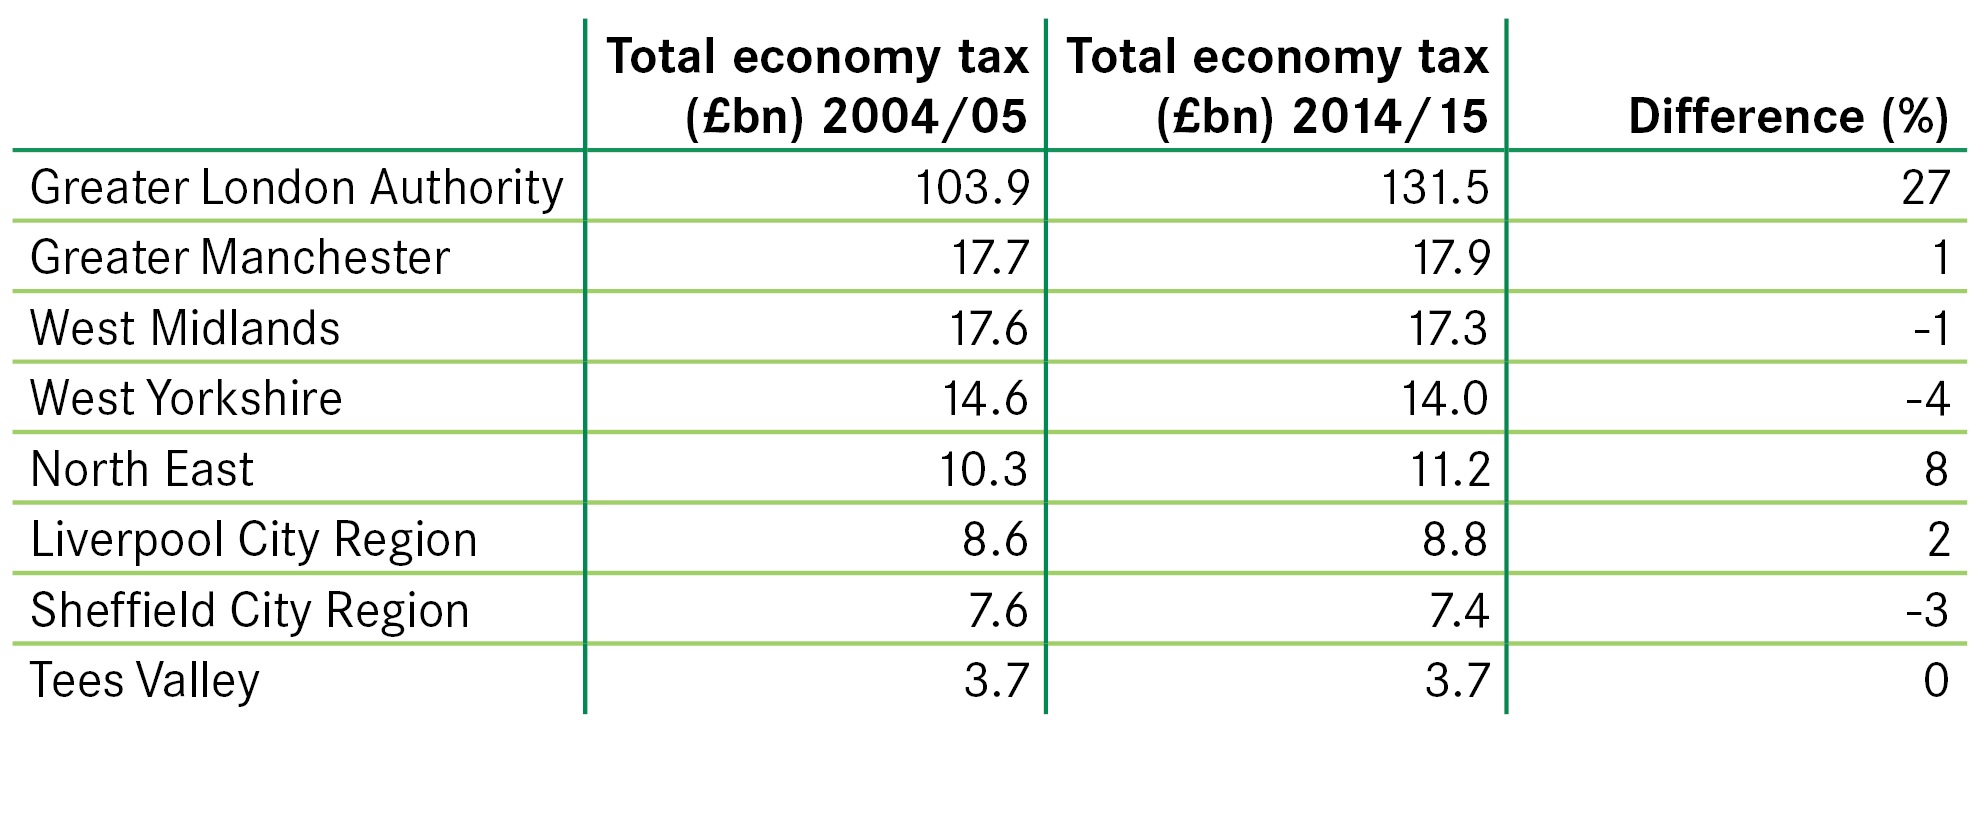
Together, the combined authority areas of Greater London, Greater Manchester, Liverpool City Region, the North East, Sheffield City Region, Tees Valley, West Midlands and West Yorkshire generated £212 billion in economy taxes. This accounted for 42 per cent of Britain’s tax take in that year. However, as the table below shows, the tax base in combined authorities outside the capital has performed below the national average of 10 per cent growth over 10 years. After Greater London, revenues grew by most in the North East, increasing 8 per cent over the decade. Revenues have grown more slowly in Greater Manchester, and even declined in the West Midlands, but in cash terms these two areas generate the highest levels of economy taxes outside Greater London, £17.9 and £17.3 billion respectively in 2014/15.
Consumption taxes have increased the most compared to other taxes but there is variation between combined authorities. In percentage terms, VAT revenues have grown by the most in the North East, an increase of 25 per cent over the decade from £2.4 billion in 2004/05 to £3.0 billion in 2014/15, compared to a national average of 20 per cent. Land and property taxes have grown more slowly, but more evenly, across areas. As a share of the land and property tax base in 2004/05, revenues from council tax, business rates and stamp duty combined have grown by the most in the North East and Liverpool City Region, both by 13 per cent over the decade – the national average was 18 per cent.
What all of this suggests is that all areas have seen spending power increase over the decade, reflected in higher levels of consumption and therefore VAT tax. And that the sale price of property and number of transactions made (which drives up stamp duty revenues), as well as revenues from council tax and business rates, have risen in all combined authorities over the decade.

Labour taxes, which make up over half of the total economy tax take nationally and are the most directly related to labour market performance, have fallen in real terms in almost all combined authorities except the North East. And in the North East where revenues increased by 3 per cent over the decade, from £5.3 to £5.5 billion, growth was still below the national average of 5 per cent. Meanwhile, capital tax revenues (which include corporation tax, capital gains tax, inheritance tax and others) are lower in all combined authorities today than a decade ago, except Greater Manchester – where they increased by 3 per cent, from £2.0 to £2.1 billion, also below the national average of 10 per cent of the decade.
The performance of labour taxes suggests that, despite an increase in employment in all combined authorities, employment growth has not translated into higher tax revenues. Part of the explanation here is stagnant wages – we explore the relationship between wages, jobs and taxes in more detail in the main report.
Digging deeper into the data highlights how the performance of the tax base differs across combined authorities and raises important questions about how economic growth has translated (or not as the case may be) into tax revenues over time. But as we know, even within city-regions, economic growth is uneven and local authorities play different roles in the dynamic of the overall area.
My next blog will look at what the data looks like at local authority level within the GLA, West Yorkshire, North East and Greater Manchester combined authorities.

Leave a comment
Be the first to add a comment.